French Canadian vs Immigrants from Middle Africa Unemployment Among Women with Children Under 6 years
COMPARE
French Canadian
Immigrants from Middle Africa
Unemployment Among Women with Children Under 6 years
Unemployment Among Women with Children Under 6 years Comparison
French Canadians
Immigrants from Middle Africa
8.4%
UNEMPLOYMENT AMONG WOMEN WITH CHILDREN UNDER 6 YEARS
0.3/ 100
METRIC RATING
265th/ 347
METRIC RANK
8.1%
UNEMPLOYMENT AMONG WOMEN WITH CHILDREN UNDER 6 YEARS
3.2/ 100
METRIC RATING
238th/ 347
METRIC RANK
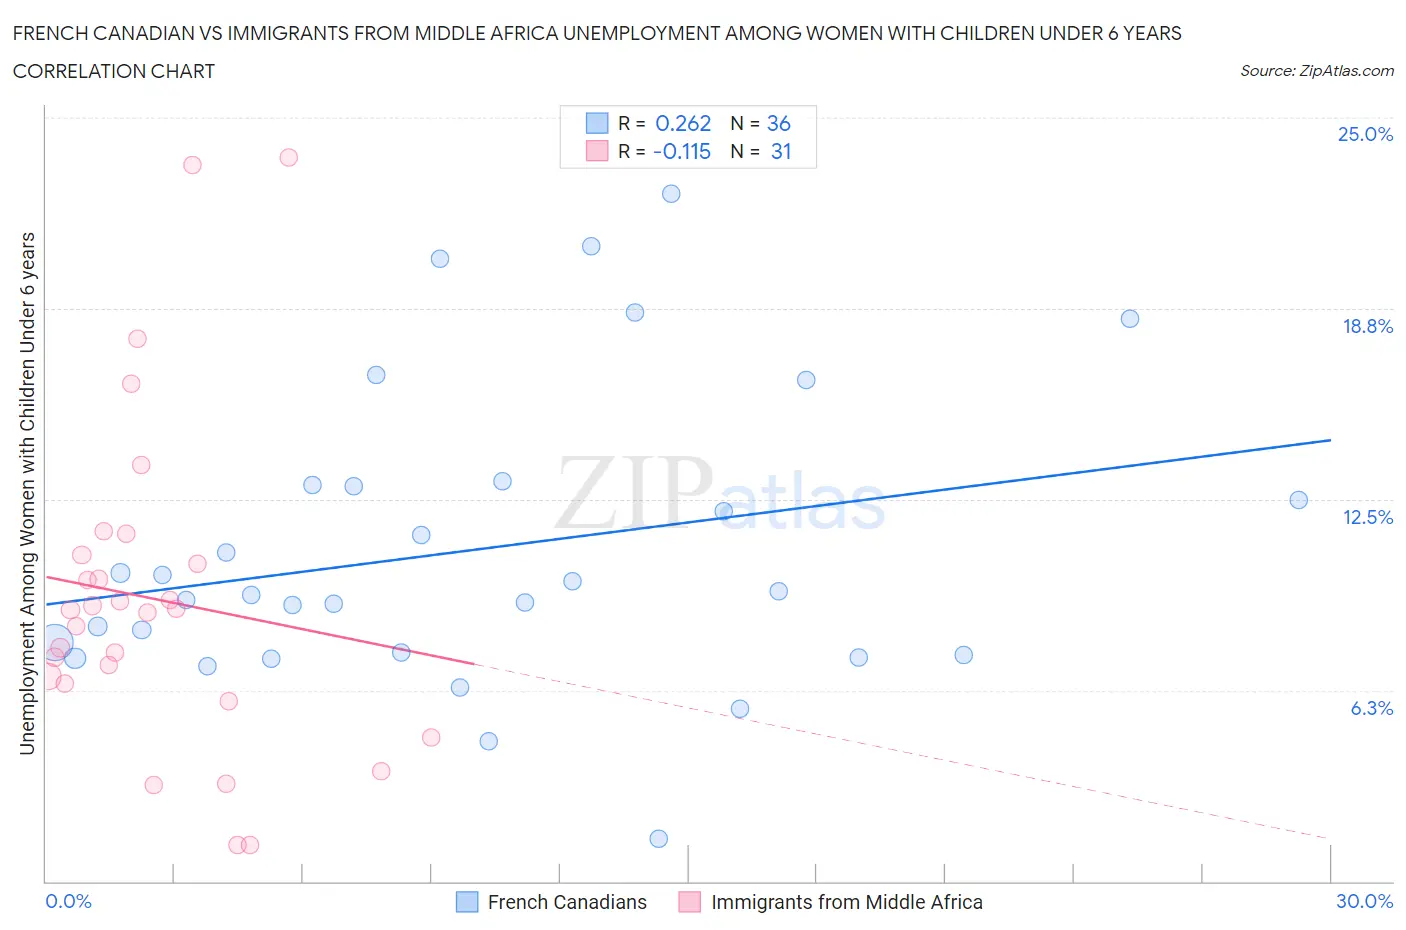
French Canadian vs Immigrants from Middle Africa Unemployment Among Women with Children Under 6 years Correlation Chart
The statistical analysis conducted on geographies consisting of 347,734,742 people shows a weak positive correlation between the proportion of French Canadians and unemployment rate among women with children under the age of 6 in the United States with a correlation coefficient (R) of 0.262 and weighted average of 8.4%. Similarly, the statistical analysis conducted on geographies consisting of 174,129,254 people shows a poor negative correlation between the proportion of Immigrants from Middle Africa and unemployment rate among women with children under the age of 6 in the United States with a correlation coefficient (R) of -0.115 and weighted average of 8.1%, a difference of 4.0%.
Unemployment Among Women with Children Under 6 years Correlation Summary
| Measurement | French Canadian | Immigrants from Middle Africa |
| Minimum | 1.4% | 1.2% |
| Maximum | 22.5% | 23.7% |
| Range | 21.1% | 22.5% |
| Mean | 10.9% | 9.2% |
| Median | 9.4% | 8.9% |
| Interquartile 25% (IQ1) | 7.4% | 6.5% |
| Interquartile 75% (IQ3) | 13.0% | 10.7% |
| Interquartile Range (IQR) | 5.5% | 4.2% |
| Standard Deviation (Sample) | 4.8% | 5.4% |
| Standard Deviation (Population) | 4.8% | 5.3% |
Similar Demographics by Unemployment Among Women with Children Under 6 years
Demographics Similar to French Canadians by Unemployment Among Women with Children Under 6 years
In terms of unemployment among women with children under 6 years, the demographic groups most similar to French Canadians are Immigrants from Honduras (8.4%, a difference of 0.0%), Honduran (8.4%, a difference of 0.050%), Scotch-Irish (8.4%, a difference of 0.070%), West Indian (8.4%, a difference of 0.10%), and Immigrants from Liberia (8.4%, a difference of 0.11%).
| Demographics | Rating | Rank | Unemployment Among Women with Children Under 6 years |
| Immigrants | Ghana | 0.5 /100 | #258 | Tragic 8.3% |
| Barbadians | 0.4 /100 | #259 | Tragic 8.3% |
| Whites/Caucasians | 0.3 /100 | #260 | Tragic 8.4% |
| Immigrants | Liberia | 0.3 /100 | #261 | Tragic 8.4% |
| West Indians | 0.3 /100 | #262 | Tragic 8.4% |
| Scotch-Irish | 0.3 /100 | #263 | Tragic 8.4% |
| Hondurans | 0.3 /100 | #264 | Tragic 8.4% |
| French Canadians | 0.3 /100 | #265 | Tragic 8.4% |
| Immigrants | Honduras | 0.3 /100 | #266 | Tragic 8.4% |
| Belizeans | 0.2 /100 | #267 | Tragic 8.4% |
| Sub-Saharan Africans | 0.2 /100 | #268 | Tragic 8.4% |
| Immigrants | Haiti | 0.2 /100 | #269 | Tragic 8.4% |
| Immigrants | Senegal | 0.2 /100 | #270 | Tragic 8.5% |
| Immigrants | Congo | 0.2 /100 | #271 | Tragic 8.5% |
| Mexican American Indians | 0.1 /100 | #272 | Tragic 8.5% |
Demographics Similar to Immigrants from Middle Africa by Unemployment Among Women with Children Under 6 years
In terms of unemployment among women with children under 6 years, the demographic groups most similar to Immigrants from Middle Africa are Irish (8.1%, a difference of 0.26%), Immigrants from El Salvador (8.1%, a difference of 0.34%), Liberian (8.1%, a difference of 0.36%), Immigrants from Costa Rica (8.0%, a difference of 0.38%), and Dutch (8.1%, a difference of 0.42%).
| Demographics | Rating | Rank | Unemployment Among Women with Children Under 6 years |
| Trinidadians and Tobagonians | 5.3 /100 | #231 | Tragic 8.0% |
| Welsh | 5.0 /100 | #232 | Tragic 8.0% |
| Immigrants | Trinidad and Tobago | 4.8 /100 | #233 | Tragic 8.0% |
| Kiowa | 4.4 /100 | #234 | Tragic 8.0% |
| Comanche | 4.3 /100 | #235 | Tragic 8.0% |
| Immigrants | Barbados | 4.2 /100 | #236 | Tragic 8.0% |
| Immigrants | Costa Rica | 4.1 /100 | #237 | Tragic 8.0% |
| Immigrants | Middle Africa | 3.2 /100 | #238 | Tragic 8.1% |
| Irish | 2.7 /100 | #239 | Tragic 8.1% |
| Immigrants | El Salvador | 2.6 /100 | #240 | Tragic 8.1% |
| Liberians | 2.6 /100 | #241 | Tragic 8.1% |
| Dutch | 2.5 /100 | #242 | Tragic 8.1% |
| Hawaiians | 1.8 /100 | #243 | Tragic 8.2% |
| French | 1.7 /100 | #244 | Tragic 8.2% |
| Native Hawaiians | 1.7 /100 | #245 | Tragic 8.2% |