Filipino vs Russian Unemployment Among Women with Children Under 6 years
COMPARE
Filipino
Russian
Unemployment Among Women with Children Under 6 years
Unemployment Among Women with Children Under 6 years Comparison
Filipinos
Russians
6.1%
UNEMPLOYMENT AMONG WOMEN WITH CHILDREN UNDER 6 YEARS
100.0/ 100
METRIC RATING
9th/ 347
METRIC RANK
7.2%
UNEMPLOYMENT AMONG WOMEN WITH CHILDREN UNDER 6 YEARS
97.5/ 100
METRIC RATING
98th/ 347
METRIC RANK
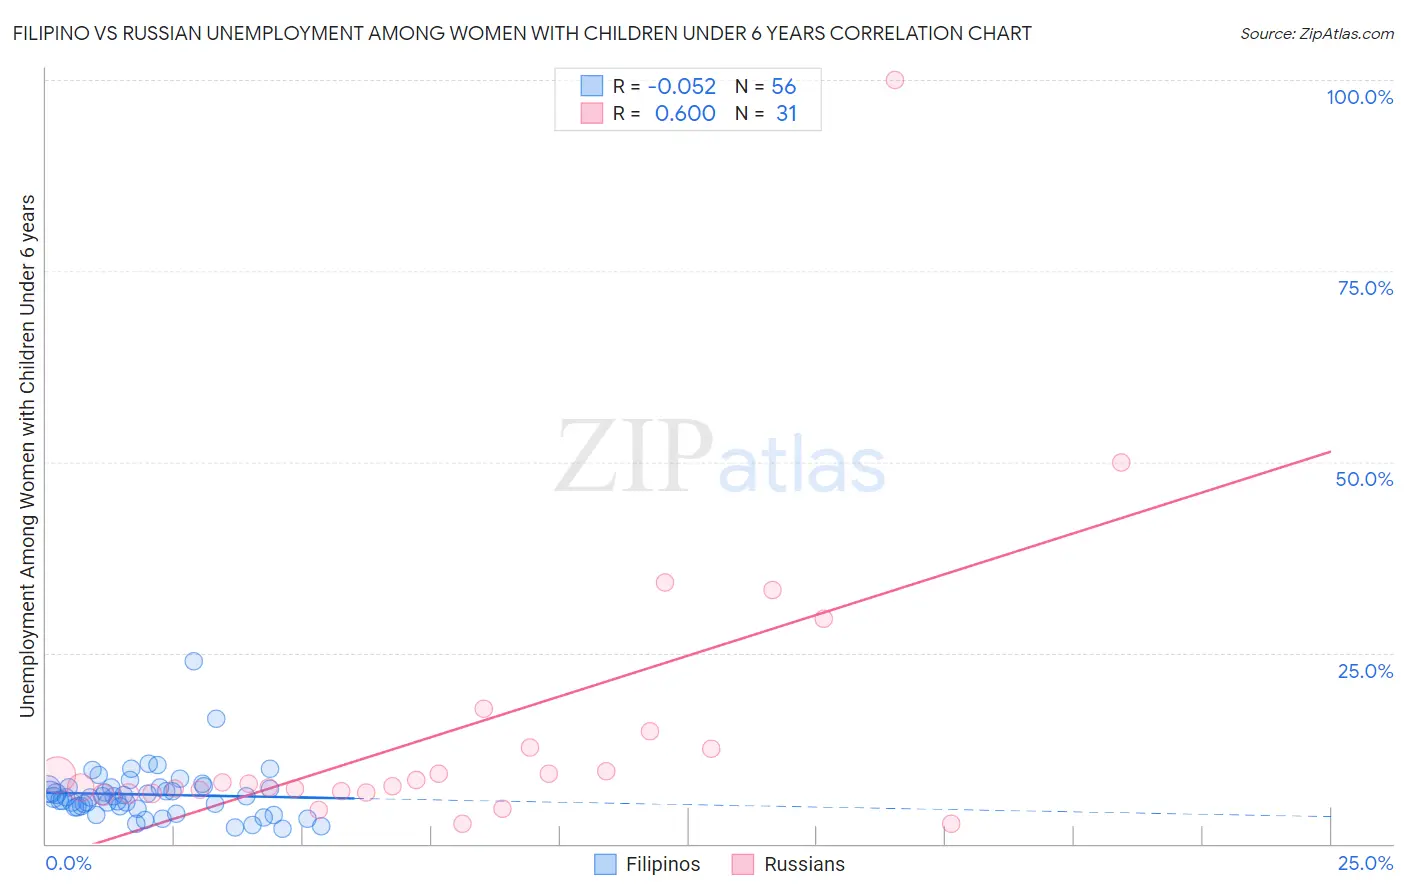
Filipino vs Russian Unemployment Among Women with Children Under 6 years Correlation Chart
The statistical analysis conducted on geographies consisting of 208,639,932 people shows a slight negative correlation between the proportion of Filipinos and unemployment rate among women with children under the age of 6 in the United States with a correlation coefficient (R) of -0.052 and weighted average of 6.1%. Similarly, the statistical analysis conducted on geographies consisting of 355,681,111 people shows a substantial positive correlation between the proportion of Russians and unemployment rate among women with children under the age of 6 in the United States with a correlation coefficient (R) of 0.600 and weighted average of 7.2%, a difference of 17.0%.
Unemployment Among Women with Children Under 6 years Correlation Summary
| Measurement | Filipino | Russian |
| Minimum | 1.9% | 2.6% |
| Maximum | 23.9% | 100.0% |
| Range | 22.0% | 97.4% |
| Mean | 6.4% | 14.7% |
| Median | 6.1% | 7.8% |
| Interquartile 25% (IQ1) | 4.8% | 6.7% |
| Interquartile 75% (IQ3) | 7.4% | 12.6% |
| Interquartile Range (IQR) | 2.6% | 5.9% |
| Standard Deviation (Sample) | 3.5% | 19.1% |
| Standard Deviation (Population) | 3.4% | 18.8% |
Similar Demographics by Unemployment Among Women with Children Under 6 years
Demographics Similar to Filipinos by Unemployment Among Women with Children Under 6 years
In terms of unemployment among women with children under 6 years, the demographic groups most similar to Filipinos are Immigrants from India (6.1%, a difference of 0.45%), Taiwanese (6.1%, a difference of 0.94%), Immigrants from Taiwan (6.0%, a difference of 1.5%), Immigrants from China (6.2%, a difference of 1.5%), and Indian (Asian) (6.3%, a difference of 2.6%).
| Demographics | Rating | Rank | Unemployment Among Women with Children Under 6 years |
| Immigrants | Hong Kong | 100.0 /100 | #2 | Exceptional 5.8% |
| Okinawans | 100.0 /100 | #3 | Exceptional 5.8% |
| Cambodians | 100.0 /100 | #4 | Exceptional 5.9% |
| Cape Verdeans | 100.0 /100 | #5 | Exceptional 5.9% |
| Immigrants | Taiwan | 100.0 /100 | #6 | Exceptional 6.0% |
| Taiwanese | 100.0 /100 | #7 | Exceptional 6.1% |
| Immigrants | India | 100.0 /100 | #8 | Exceptional 6.1% |
| Filipinos | 100.0 /100 | #9 | Exceptional 6.1% |
| Immigrants | China | 100.0 /100 | #10 | Exceptional 6.2% |
| Indians (Asian) | 100.0 /100 | #11 | Exceptional 6.3% |
| Immigrants | Singapore | 100.0 /100 | #12 | Exceptional 6.3% |
| Immigrants | Eastern Asia | 100.0 /100 | #13 | Exceptional 6.3% |
| Immigrants | Bulgaria | 100.0 /100 | #14 | Exceptional 6.3% |
| Thais | 100.0 /100 | #15 | Exceptional 6.3% |
| Immigrants | Uzbekistan | 100.0 /100 | #16 | Exceptional 6.3% |
Demographics Similar to Russians by Unemployment Among Women with Children Under 6 years
In terms of unemployment among women with children under 6 years, the demographic groups most similar to Russians are Immigrants from South Eastern Asia (7.2%, a difference of 0.030%), Immigrants from Europe (7.2%, a difference of 0.040%), Immigrants from Northern Europe (7.2%, a difference of 0.080%), Immigrants from Eastern Africa (7.2%, a difference of 0.11%), and Chilean (7.2%, a difference of 0.11%).
| Demographics | Rating | Rank | Unemployment Among Women with Children Under 6 years |
| Danes | 98.2 /100 | #91 | Exceptional 7.1% |
| Albanians | 98.0 /100 | #92 | Exceptional 7.2% |
| New Zealanders | 97.8 /100 | #93 | Exceptional 7.2% |
| Macedonians | 97.7 /100 | #94 | Exceptional 7.2% |
| Romanians | 97.7 /100 | #95 | Exceptional 7.2% |
| Immigrants | Eastern Africa | 97.7 /100 | #96 | Exceptional 7.2% |
| Immigrants | South Eastern Asia | 97.6 /100 | #97 | Exceptional 7.2% |
| Russians | 97.5 /100 | #98 | Exceptional 7.2% |
| Immigrants | Europe | 97.5 /100 | #99 | Exceptional 7.2% |
| Immigrants | Northern Europe | 97.4 /100 | #100 | Exceptional 7.2% |
| Chileans | 97.4 /100 | #101 | Exceptional 7.2% |
| Immigrants | Nicaragua | 97.3 /100 | #102 | Exceptional 7.2% |
| Immigrants | Saudi Arabia | 97.3 /100 | #103 | Exceptional 7.2% |
| Immigrants | Egypt | 97.2 /100 | #104 | Exceptional 7.2% |
| Venezuelans | 97.2 /100 | #105 | Exceptional 7.2% |