Belizean vs Immigrants from Eritrea Male Unemployment
COMPARE
Belizean
Immigrants from Eritrea
Male Unemployment
Male Unemployment Comparison
Belizeans
Immigrants from Eritrea
6.5%
MALE UNEMPLOYMENT
0.0/ 100
METRIC RATING
295th/ 347
METRIC RANK
5.0%
MALE UNEMPLOYMENT
96.0/ 100
METRIC RATING
83rd/ 347
METRIC RANK
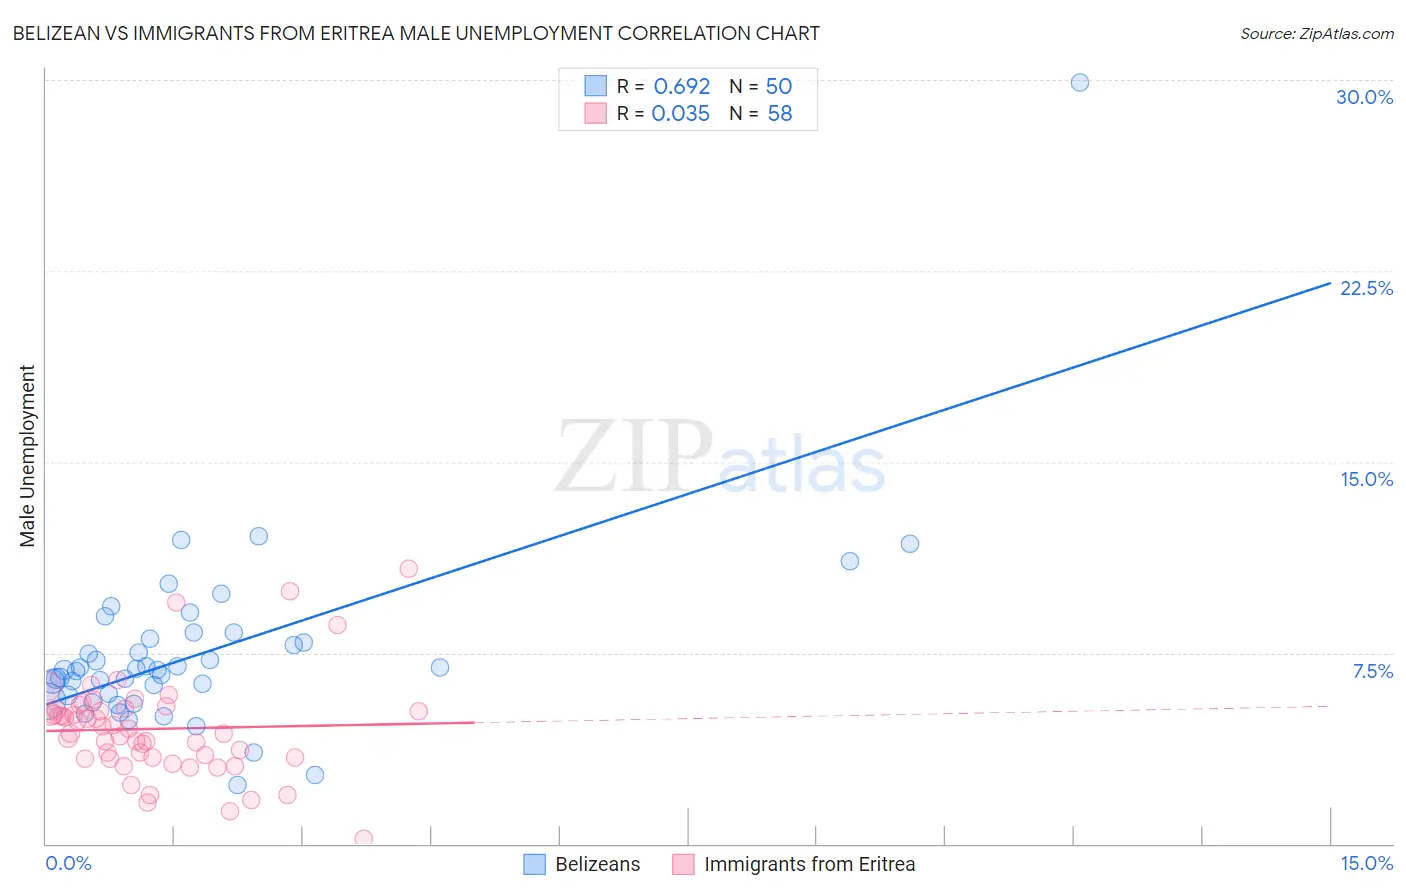
Belizean vs Immigrants from Eritrea Male Unemployment Correlation Chart
The statistical analysis conducted on geographies consisting of 144,079,260 people shows a significant positive correlation between the proportion of Belizeans and unemployment rate among males in the United States with a correlation coefficient (R) of 0.692 and weighted average of 6.5%. Similarly, the statistical analysis conducted on geographies consisting of 104,807,981 people shows no correlation between the proportion of Immigrants from Eritrea and unemployment rate among males in the United States with a correlation coefficient (R) of 0.035 and weighted average of 5.0%, a difference of 28.8%.
Male Unemployment Correlation Summary
| Measurement | Belizean | Immigrants from Eritrea |
| Minimum | 2.3% | 0.20% |
| Maximum | 29.9% | 10.8% |
| Range | 27.6% | 10.6% |
| Mean | 7.5% | 4.5% |
| Median | 6.8% | 4.4% |
| Interquartile 25% (IQ1) | 5.8% | 3.4% |
| Interquartile 75% (IQ3) | 8.1% | 5.3% |
| Interquartile Range (IQR) | 2.2% | 1.9% |
| Standard Deviation (Sample) | 3.9% | 1.9% |
| Standard Deviation (Population) | 3.8% | 1.9% |
Similar Demographics by Male Unemployment
Demographics Similar to Belizeans by Male Unemployment
In terms of male unemployment, the demographic groups most similar to Belizeans are Immigrants from Haiti (6.5%, a difference of 0.45%), Chippewa (6.6%, a difference of 0.77%), Senegalese (6.4%, a difference of 0.85%), Jamaican (6.6%, a difference of 0.85%), and Haitian (6.4%, a difference of 0.96%).
| Demographics | Rating | Rank | Male Unemployment |
| Immigrants | Senegal | 0.0 /100 | #288 | Tragic 6.3% |
| Immigrants | Caribbean | 0.0 /100 | #289 | Tragic 6.3% |
| U.S. Virgin Islanders | 0.0 /100 | #290 | Tragic 6.4% |
| Immigrants | Azores | 0.0 /100 | #291 | Tragic 6.4% |
| Nepalese | 0.0 /100 | #292 | Tragic 6.4% |
| Haitians | 0.0 /100 | #293 | Tragic 6.4% |
| Senegalese | 0.0 /100 | #294 | Tragic 6.4% |
| Belizeans | 0.0 /100 | #295 | Tragic 6.5% |
| Immigrants | Haiti | 0.0 /100 | #296 | Tragic 6.5% |
| Chippewa | 0.0 /100 | #297 | Tragic 6.6% |
| Jamaicans | 0.0 /100 | #298 | Tragic 6.6% |
| Immigrants | Bangladesh | 0.0 /100 | #299 | Tragic 6.6% |
| Vietnamese | 0.0 /100 | #300 | Tragic 6.6% |
| Immigrants | Belize | 0.0 /100 | #301 | Tragic 6.6% |
| Ute | 0.0 /100 | #302 | Tragic 6.6% |
Demographics Similar to Immigrants from Eritrea by Male Unemployment
In terms of male unemployment, the demographic groups most similar to Immigrants from Eritrea are Chilean (5.0%, a difference of 0.060%), Argentinean (5.0%, a difference of 0.090%), French (5.0%, a difference of 0.090%), Serbian (5.1%, a difference of 0.12%), and South African (5.0%, a difference of 0.14%).
| Demographics | Rating | Rank | Male Unemployment |
| Immigrants | Sudan | 96.5 /100 | #76 | Exceptional 5.0% |
| Iranians | 96.4 /100 | #77 | Exceptional 5.0% |
| Immigrants | Northern Europe | 96.4 /100 | #78 | Exceptional 5.0% |
| South Africans | 96.4 /100 | #79 | Exceptional 5.0% |
| Argentineans | 96.2 /100 | #80 | Exceptional 5.0% |
| French | 96.2 /100 | #81 | Exceptional 5.0% |
| Chileans | 96.2 /100 | #82 | Exceptional 5.0% |
| Immigrants | Eritrea | 96.0 /100 | #83 | Exceptional 5.0% |
| Serbians | 95.7 /100 | #84 | Exceptional 5.1% |
| Immigrants | North Macedonia | 95.6 /100 | #85 | Exceptional 5.1% |
| Maltese | 95.5 /100 | #86 | Exceptional 5.1% |
| Immigrants | Romania | 95.4 /100 | #87 | Exceptional 5.1% |
| Immigrants | Sri Lanka | 94.9 /100 | #88 | Exceptional 5.1% |
| Immigrants | Australia | 94.7 /100 | #89 | Exceptional 5.1% |
| Okinawans | 94.7 /100 | #90 | Exceptional 5.1% |