Dutch vs Swedish Male Unemployment
COMPARE
Dutch
Swedish
Male Unemployment
Male Unemployment Comparison
Dutch
Swedes
4.8%
MALE UNEMPLOYMENT
99.9/ 100
METRIC RATING
26th/ 347
METRIC RANK
4.6%
MALE UNEMPLOYMENT
100.0/ 100
METRIC RATING
11th/ 347
METRIC RANK
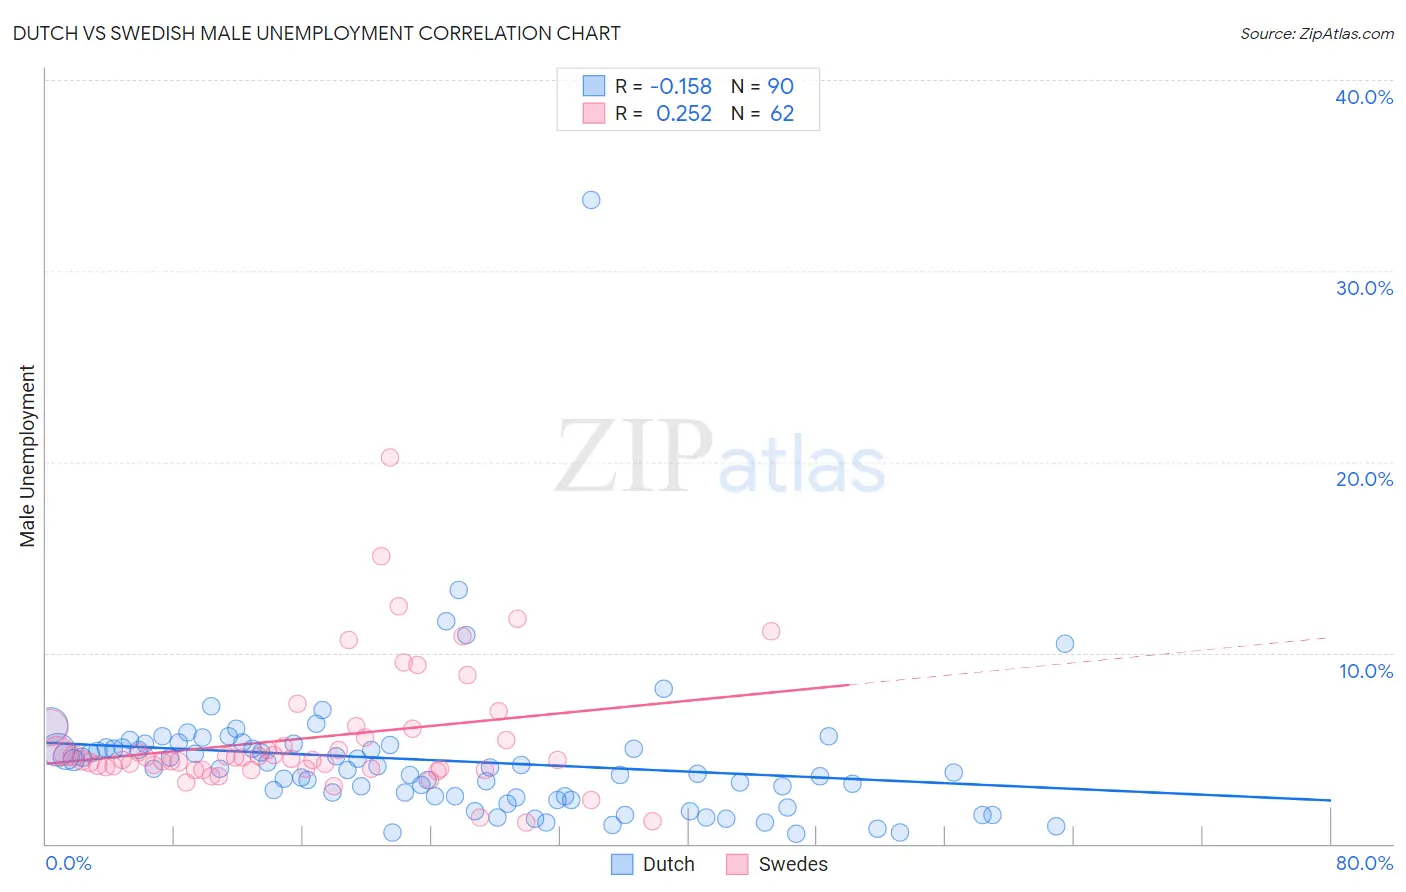
Dutch vs Swedish Male Unemployment Correlation Chart
The statistical analysis conducted on geographies consisting of 544,964,773 people shows a poor negative correlation between the proportion of Dutch and unemployment rate among males in the United States with a correlation coefficient (R) of -0.158 and weighted average of 4.8%. Similarly, the statistical analysis conducted on geographies consisting of 530,954,866 people shows a weak positive correlation between the proportion of Swedes and unemployment rate among males in the United States with a correlation coefficient (R) of 0.252 and weighted average of 4.6%, a difference of 3.3%.
Male Unemployment Correlation Summary
| Measurement | Dutch | Swedish |
| Minimum | 0.50% | 1.1% |
| Maximum | 33.7% | 20.3% |
| Range | 33.2% | 19.2% |
| Mean | 4.4% | 5.5% |
| Median | 3.9% | 4.4% |
| Interquartile 25% (IQ1) | 2.5% | 3.9% |
| Interquartile 75% (IQ3) | 5.1% | 5.6% |
| Interquartile Range (IQR) | 2.6% | 1.7% |
| Standard Deviation (Sample) | 3.9% | 3.3% |
| Standard Deviation (Population) | 3.9% | 3.3% |
Demographics Similar to Dutch and Swedes by Male Unemployment
In terms of male unemployment, the demographic groups most similar to Dutch are Zimbabwean (4.8%, a difference of 0.020%), Immigrants from South Central Asia (4.8%, a difference of 0.12%), Tongan (4.8%, a difference of 0.15%), Carpatho Rusyn (4.8%, a difference of 0.20%), and Belgian (4.8%, a difference of 0.20%). Similarly, the demographic groups most similar to Swedes are Cuban (4.6%, a difference of 0.20%), Immigrants from Bolivia (4.7%, a difference of 0.73%), Thai (4.6%, a difference of 0.81%), Bolivian (4.7%, a difference of 1.4%), and German (4.7%, a difference of 1.4%).
| Demographics | Rating | Rank | Male Unemployment |
| Luxembourgers | 100.0 /100 | #8 | Exceptional 4.5% |
| Thais | 100.0 /100 | #9 | Exceptional 4.6% |
| Cubans | 100.0 /100 | #10 | Exceptional 4.6% |
| Swedes | 100.0 /100 | #11 | Exceptional 4.6% |
| Immigrants | Bolivia | 100.0 /100 | #12 | Exceptional 4.7% |
| Bolivians | 100.0 /100 | #13 | Exceptional 4.7% |
| Germans | 100.0 /100 | #14 | Exceptional 4.7% |
| Scandinavians | 100.0 /100 | #15 | Exceptional 4.7% |
| Swiss | 99.9 /100 | #16 | Exceptional 4.7% |
| Filipinos | 99.9 /100 | #17 | Exceptional 4.7% |
| English | 99.9 /100 | #18 | Exceptional 4.8% |
| Europeans | 99.9 /100 | #19 | Exceptional 4.8% |
| Pennsylvania Germans | 99.9 /100 | #20 | Exceptional 4.8% |
| Immigrants | Taiwan | 99.9 /100 | #21 | Exceptional 4.8% |
| Carpatho Rusyns | 99.9 /100 | #22 | Exceptional 4.8% |
| Tongans | 99.9 /100 | #23 | Exceptional 4.8% |
| Immigrants | South Central Asia | 99.9 /100 | #24 | Exceptional 4.8% |
| Zimbabweans | 99.9 /100 | #25 | Exceptional 4.8% |
| Dutch | 99.9 /100 | #26 | Exceptional 4.8% |
| Belgians | 99.9 /100 | #27 | Exceptional 4.8% |
| Bulgarians | 99.8 /100 | #28 | Exceptional 4.8% |