Dutch vs Macedonian Male Unemployment
COMPARE
Dutch
Macedonian
Male Unemployment
Male Unemployment Comparison
Dutch
Macedonians
4.8%
MALE UNEMPLOYMENT
99.9/ 100
METRIC RATING
26th/ 347
METRIC RANK
5.2%
MALE UNEMPLOYMENT
77.7/ 100
METRIC RATING
145th/ 347
METRIC RANK
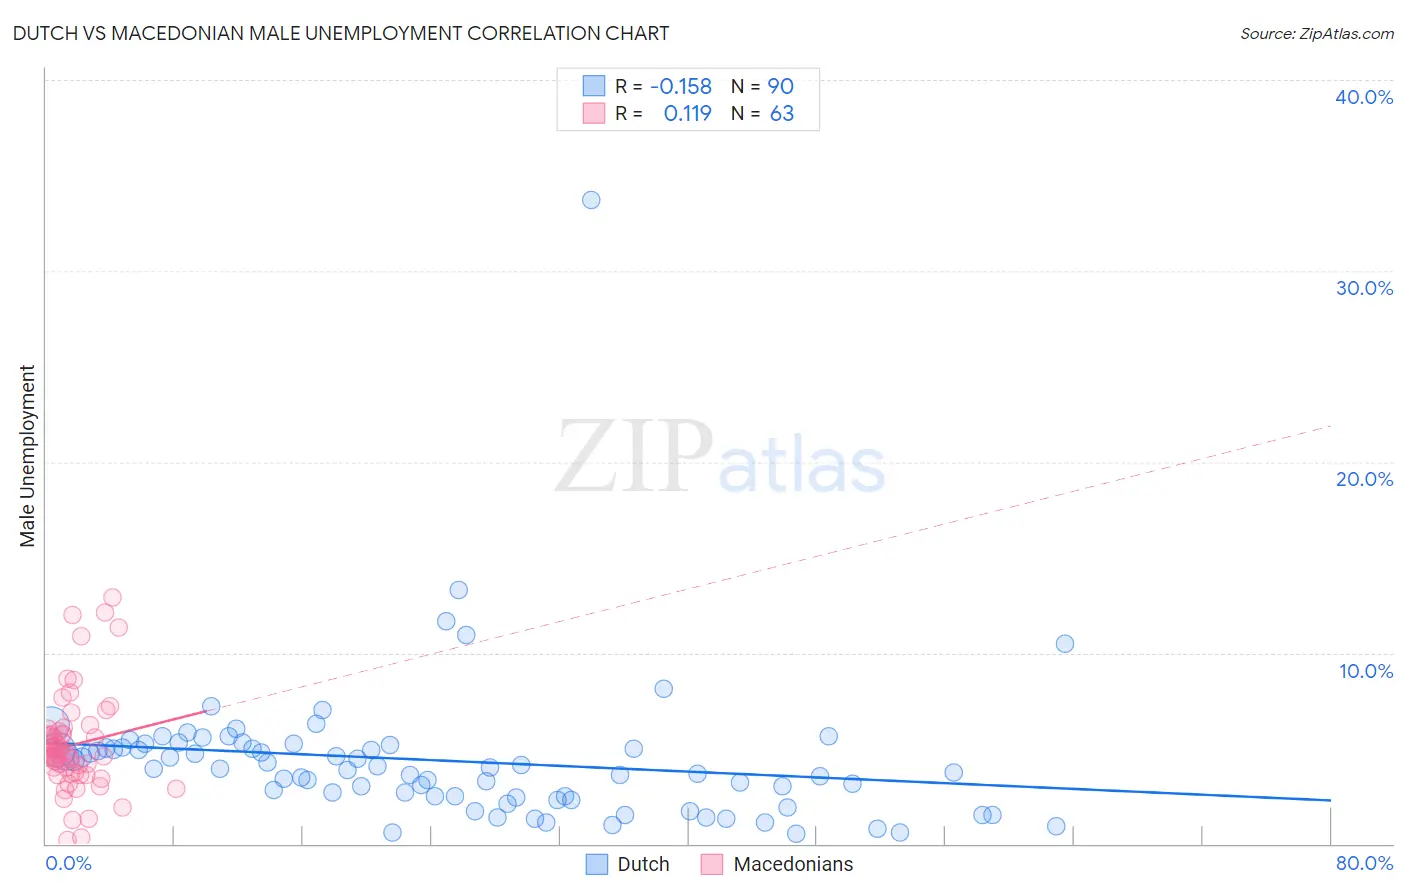
Dutch vs Macedonian Male Unemployment Correlation Chart
The statistical analysis conducted on geographies consisting of 544,964,773 people shows a poor negative correlation between the proportion of Dutch and unemployment rate among males in the United States with a correlation coefficient (R) of -0.158 and weighted average of 4.8%. Similarly, the statistical analysis conducted on geographies consisting of 132,415,215 people shows a poor positive correlation between the proportion of Macedonians and unemployment rate among males in the United States with a correlation coefficient (R) of 0.119 and weighted average of 5.2%, a difference of 8.8%.
Male Unemployment Correlation Summary
| Measurement | Dutch | Macedonian |
| Minimum | 0.50% | 0.20% |
| Maximum | 33.7% | 12.9% |
| Range | 33.2% | 12.7% |
| Mean | 4.4% | 5.2% |
| Median | 3.9% | 4.7% |
| Interquartile 25% (IQ1) | 2.5% | 3.7% |
| Interquartile 75% (IQ3) | 5.1% | 5.9% |
| Interquartile Range (IQR) | 2.6% | 2.2% |
| Standard Deviation (Sample) | 3.9% | 2.6% |
| Standard Deviation (Population) | 3.9% | 2.6% |
Similar Demographics by Male Unemployment
Demographics Similar to Dutch by Male Unemployment
In terms of male unemployment, the demographic groups most similar to Dutch are Zimbabwean (4.8%, a difference of 0.020%), Immigrants from South Central Asia (4.8%, a difference of 0.12%), Tongan (4.8%, a difference of 0.15%), Carpatho Rusyn (4.8%, a difference of 0.20%), and Belgian (4.8%, a difference of 0.20%).
| Demographics | Rating | Rank | Male Unemployment |
| Europeans | 99.9 /100 | #19 | Exceptional 4.8% |
| Pennsylvania Germans | 99.9 /100 | #20 | Exceptional 4.8% |
| Immigrants | Taiwan | 99.9 /100 | #21 | Exceptional 4.8% |
| Carpatho Rusyns | 99.9 /100 | #22 | Exceptional 4.8% |
| Tongans | 99.9 /100 | #23 | Exceptional 4.8% |
| Immigrants | South Central Asia | 99.9 /100 | #24 | Exceptional 4.8% |
| Zimbabweans | 99.9 /100 | #25 | Exceptional 4.8% |
| Dutch | 99.9 /100 | #26 | Exceptional 4.8% |
| Belgians | 99.9 /100 | #27 | Exceptional 4.8% |
| Bulgarians | 99.8 /100 | #28 | Exceptional 4.8% |
| Scottish | 99.8 /100 | #29 | Exceptional 4.8% |
| British | 99.8 /100 | #30 | Exceptional 4.8% |
| Sudanese | 99.8 /100 | #31 | Exceptional 4.8% |
| Immigrants | Nepal | 99.8 /100 | #32 | Exceptional 4.8% |
| Latvians | 99.7 /100 | #33 | Exceptional 4.8% |
Demographics Similar to Macedonians by Male Unemployment
In terms of male unemployment, the demographic groups most similar to Macedonians are Sri Lankan (5.2%, a difference of 0.010%), Immigrants from Kenya (5.2%, a difference of 0.010%), Syrian (5.2%, a difference of 0.020%), Immigrants from Burma/Myanmar (5.2%, a difference of 0.020%), and Fijian (5.2%, a difference of 0.050%).
| Demographics | Rating | Rank | Male Unemployment |
| Immigrants | Croatia | 79.7 /100 | #138 | Good 5.2% |
| Kenyans | 79.4 /100 | #139 | Good 5.2% |
| Brazilians | 79.3 /100 | #140 | Good 5.2% |
| Immigrants | Switzerland | 79.2 /100 | #141 | Good 5.2% |
| Fijians | 78.3 /100 | #142 | Good 5.2% |
| Syrians | 78.0 /100 | #143 | Good 5.2% |
| Sri Lankans | 77.9 /100 | #144 | Good 5.2% |
| Macedonians | 77.7 /100 | #145 | Good 5.2% |
| Immigrants | Kenya | 77.6 /100 | #146 | Good 5.2% |
| Immigrants | Burma/Myanmar | 77.5 /100 | #147 | Good 5.2% |
| Immigrants | Italy | 76.3 /100 | #148 | Good 5.2% |
| Immigrants | Europe | 76.2 /100 | #149 | Good 5.2% |
| Indians (Asian) | 76.0 /100 | #150 | Good 5.2% |
| Slovaks | 75.5 /100 | #151 | Good 5.2% |
| Egyptians | 74.8 /100 | #152 | Good 5.2% |