Fijian vs Immigrants from Eritrea Male Unemployment
COMPARE
Fijian
Immigrants from Eritrea
Male Unemployment
Male Unemployment Comparison
Fijians
Immigrants from Eritrea
5.2%
MALE UNEMPLOYMENT
78.3/ 100
METRIC RATING
142nd/ 347
METRIC RANK
5.0%
MALE UNEMPLOYMENT
96.0/ 100
METRIC RATING
83rd/ 347
METRIC RANK
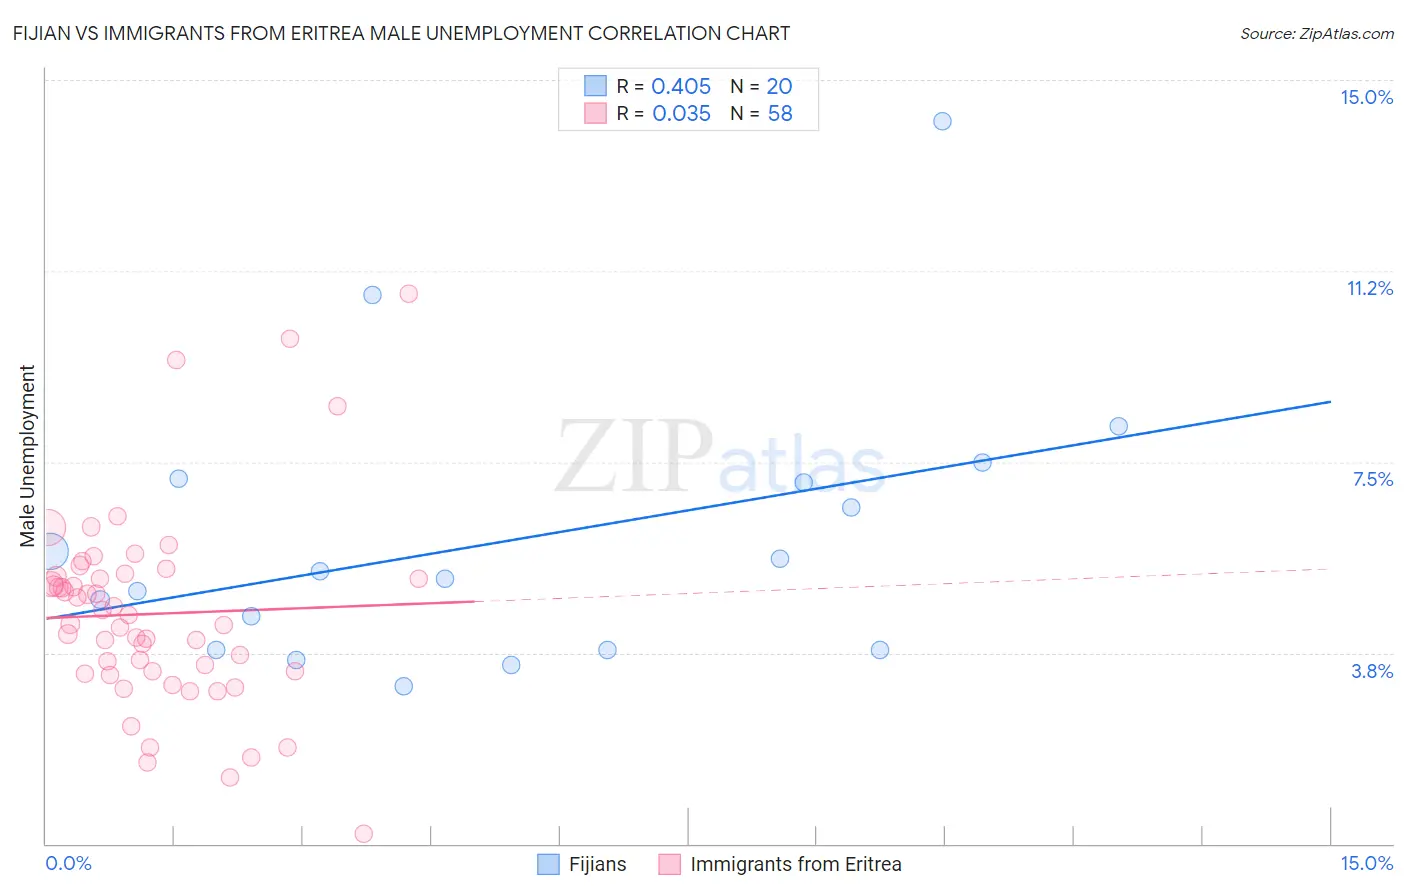
Fijian vs Immigrants from Eritrea Male Unemployment Correlation Chart
The statistical analysis conducted on geographies consisting of 55,914,259 people shows a moderate positive correlation between the proportion of Fijians and unemployment rate among males in the United States with a correlation coefficient (R) of 0.405 and weighted average of 5.2%. Similarly, the statistical analysis conducted on geographies consisting of 104,807,981 people shows no correlation between the proportion of Immigrants from Eritrea and unemployment rate among males in the United States with a correlation coefficient (R) of 0.035 and weighted average of 5.0%, a difference of 2.9%.
Male Unemployment Correlation Summary
| Measurement | Fijian | Immigrants from Eritrea |
| Minimum | 3.1% | 0.20% |
| Maximum | 14.2% | 10.8% |
| Range | 11.1% | 10.6% |
| Mean | 6.0% | 4.5% |
| Median | 5.3% | 4.4% |
| Interquartile 25% (IQ1) | 3.8% | 3.4% |
| Interquartile 75% (IQ3) | 7.1% | 5.3% |
| Interquartile Range (IQR) | 3.3% | 1.9% |
| Standard Deviation (Sample) | 2.7% | 1.9% |
| Standard Deviation (Population) | 2.7% | 1.9% |
Similar Demographics by Male Unemployment
Demographics Similar to Fijians by Male Unemployment
In terms of male unemployment, the demographic groups most similar to Fijians are Syrian (5.2%, a difference of 0.030%), Sri Lankan (5.2%, a difference of 0.030%), Macedonian (5.2%, a difference of 0.050%), Immigrants from Kenya (5.2%, a difference of 0.050%), and Immigrants from Burma/Myanmar (5.2%, a difference of 0.070%).
| Demographics | Rating | Rank | Male Unemployment |
| Immigrants | Saudi Arabia | 80.1 /100 | #135 | Excellent 5.2% |
| Lebanese | 79.9 /100 | #136 | Good 5.2% |
| Immigrants | Eastern Africa | 79.8 /100 | #137 | Good 5.2% |
| Immigrants | Croatia | 79.7 /100 | #138 | Good 5.2% |
| Kenyans | 79.4 /100 | #139 | Good 5.2% |
| Brazilians | 79.3 /100 | #140 | Good 5.2% |
| Immigrants | Switzerland | 79.2 /100 | #141 | Good 5.2% |
| Fijians | 78.3 /100 | #142 | Good 5.2% |
| Syrians | 78.0 /100 | #143 | Good 5.2% |
| Sri Lankans | 77.9 /100 | #144 | Good 5.2% |
| Macedonians | 77.7 /100 | #145 | Good 5.2% |
| Immigrants | Kenya | 77.6 /100 | #146 | Good 5.2% |
| Immigrants | Burma/Myanmar | 77.5 /100 | #147 | Good 5.2% |
| Immigrants | Italy | 76.3 /100 | #148 | Good 5.2% |
| Immigrants | Europe | 76.2 /100 | #149 | Good 5.2% |
Demographics Similar to Immigrants from Eritrea by Male Unemployment
In terms of male unemployment, the demographic groups most similar to Immigrants from Eritrea are Chilean (5.0%, a difference of 0.060%), Argentinean (5.0%, a difference of 0.090%), French (5.0%, a difference of 0.090%), Serbian (5.1%, a difference of 0.12%), and South African (5.0%, a difference of 0.14%).
| Demographics | Rating | Rank | Male Unemployment |
| Immigrants | Sudan | 96.5 /100 | #76 | Exceptional 5.0% |
| Iranians | 96.4 /100 | #77 | Exceptional 5.0% |
| Immigrants | Northern Europe | 96.4 /100 | #78 | Exceptional 5.0% |
| South Africans | 96.4 /100 | #79 | Exceptional 5.0% |
| Argentineans | 96.2 /100 | #80 | Exceptional 5.0% |
| French | 96.2 /100 | #81 | Exceptional 5.0% |
| Chileans | 96.2 /100 | #82 | Exceptional 5.0% |
| Immigrants | Eritrea | 96.0 /100 | #83 | Exceptional 5.0% |
| Serbians | 95.7 /100 | #84 | Exceptional 5.1% |
| Immigrants | North Macedonia | 95.6 /100 | #85 | Exceptional 5.1% |
| Maltese | 95.5 /100 | #86 | Exceptional 5.1% |
| Immigrants | Romania | 95.4 /100 | #87 | Exceptional 5.1% |
| Immigrants | Sri Lanka | 94.9 /100 | #88 | Exceptional 5.1% |
| Immigrants | Australia | 94.7 /100 | #89 | Exceptional 5.1% |
| Okinawans | 94.7 /100 | #90 | Exceptional 5.1% |