Guyanese vs Immigrants from Eritrea Male Unemployment
COMPARE
Guyanese
Immigrants from Eritrea
Male Unemployment
Male Unemployment Comparison
Guyanese
Immigrants from Eritrea
7.1%
MALE UNEMPLOYMENT
0.0/ 100
METRIC RATING
317th/ 347
METRIC RANK
5.0%
MALE UNEMPLOYMENT
96.0/ 100
METRIC RATING
83rd/ 347
METRIC RANK
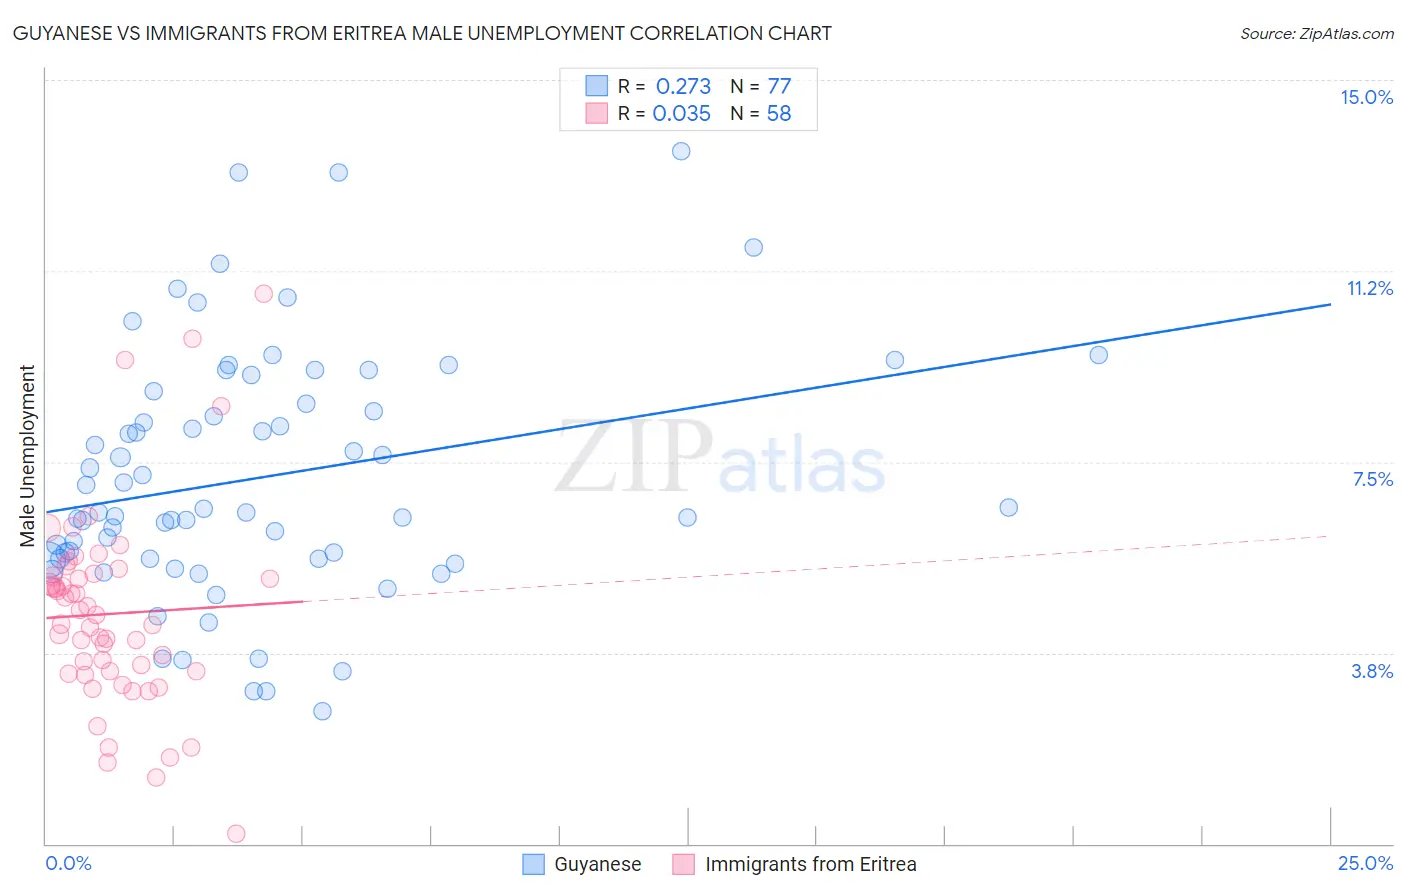
Guyanese vs Immigrants from Eritrea Male Unemployment Correlation Chart
The statistical analysis conducted on geographies consisting of 176,637,764 people shows a weak positive correlation between the proportion of Guyanese and unemployment rate among males in the United States with a correlation coefficient (R) of 0.273 and weighted average of 7.1%. Similarly, the statistical analysis conducted on geographies consisting of 104,807,981 people shows no correlation between the proportion of Immigrants from Eritrea and unemployment rate among males in the United States with a correlation coefficient (R) of 0.035 and weighted average of 5.0%, a difference of 40.9%.
Male Unemployment Correlation Summary
| Measurement | Guyanese | Immigrants from Eritrea |
| Minimum | 2.6% | 0.20% |
| Maximum | 13.6% | 10.8% |
| Range | 11.0% | 10.6% |
| Mean | 7.2% | 4.5% |
| Median | 6.5% | 4.4% |
| Interquartile 25% (IQ1) | 5.6% | 3.4% |
| Interquartile 75% (IQ3) | 8.8% | 5.3% |
| Interquartile Range (IQR) | 3.2% | 1.9% |
| Standard Deviation (Sample) | 2.4% | 1.9% |
| Standard Deviation (Population) | 2.4% | 1.9% |
Similar Demographics by Male Unemployment
Demographics Similar to Guyanese by Male Unemployment
In terms of male unemployment, the demographic groups most similar to Guyanese are Immigrants from Guyana (7.1%, a difference of 0.060%), Cape Verdean (7.1%, a difference of 0.070%), Houma (7.1%, a difference of 0.080%), Immigrants from Barbados (7.1%, a difference of 0.30%), and Immigrants from Dominica (7.0%, a difference of 1.6%).
| Demographics | Rating | Rank | Male Unemployment |
| Blacks/African Americans | 0.0 /100 | #310 | Tragic 6.9% |
| Immigrants | Armenia | 0.0 /100 | #311 | Tragic 6.9% |
| Lumbee | 0.0 /100 | #312 | Tragic 6.9% |
| Immigrants | Dominica | 0.0 /100 | #313 | Tragic 7.0% |
| Immigrants | Barbados | 0.0 /100 | #314 | Tragic 7.1% |
| Houma | 0.0 /100 | #315 | Tragic 7.1% |
| Immigrants | Guyana | 0.0 /100 | #316 | Tragic 7.1% |
| Guyanese | 0.0 /100 | #317 | Tragic 7.1% |
| Cape Verdeans | 0.0 /100 | #318 | Tragic 7.1% |
| British West Indians | 0.0 /100 | #319 | Tragic 7.3% |
| Colville | 0.0 /100 | #320 | Tragic 7.4% |
| Immigrants | St. Vincent and the Grenadines | 0.0 /100 | #321 | Tragic 7.5% |
| Immigrants | Cabo Verde | 0.0 /100 | #322 | Tragic 7.5% |
| Immigrants | Grenada | 0.0 /100 | #323 | Tragic 7.6% |
| Dominicans | 0.0 /100 | #324 | Tragic 7.6% |
Demographics Similar to Immigrants from Eritrea by Male Unemployment
In terms of male unemployment, the demographic groups most similar to Immigrants from Eritrea are Chilean (5.0%, a difference of 0.060%), Argentinean (5.0%, a difference of 0.090%), French (5.0%, a difference of 0.090%), Serbian (5.1%, a difference of 0.12%), and South African (5.0%, a difference of 0.14%).
| Demographics | Rating | Rank | Male Unemployment |
| Immigrants | Sudan | 96.5 /100 | #76 | Exceptional 5.0% |
| Iranians | 96.4 /100 | #77 | Exceptional 5.0% |
| Immigrants | Northern Europe | 96.4 /100 | #78 | Exceptional 5.0% |
| South Africans | 96.4 /100 | #79 | Exceptional 5.0% |
| Argentineans | 96.2 /100 | #80 | Exceptional 5.0% |
| French | 96.2 /100 | #81 | Exceptional 5.0% |
| Chileans | 96.2 /100 | #82 | Exceptional 5.0% |
| Immigrants | Eritrea | 96.0 /100 | #83 | Exceptional 5.0% |
| Serbians | 95.7 /100 | #84 | Exceptional 5.1% |
| Immigrants | North Macedonia | 95.6 /100 | #85 | Exceptional 5.1% |
| Maltese | 95.5 /100 | #86 | Exceptional 5.1% |
| Immigrants | Romania | 95.4 /100 | #87 | Exceptional 5.1% |
| Immigrants | Sri Lanka | 94.9 /100 | #88 | Exceptional 5.1% |
| Immigrants | Australia | 94.7 /100 | #89 | Exceptional 5.1% |
| Okinawans | 94.7 /100 | #90 | Exceptional 5.1% |