Dutch vs Peruvian Male Unemployment
COMPARE
Dutch
Peruvian
Male Unemployment
Male Unemployment Comparison
Dutch
Peruvians
4.8%
MALE UNEMPLOYMENT
99.9/ 100
METRIC RATING
26th/ 347
METRIC RANK
5.3%
MALE UNEMPLOYMENT
51.9/ 100
METRIC RATING
171st/ 347
METRIC RANK
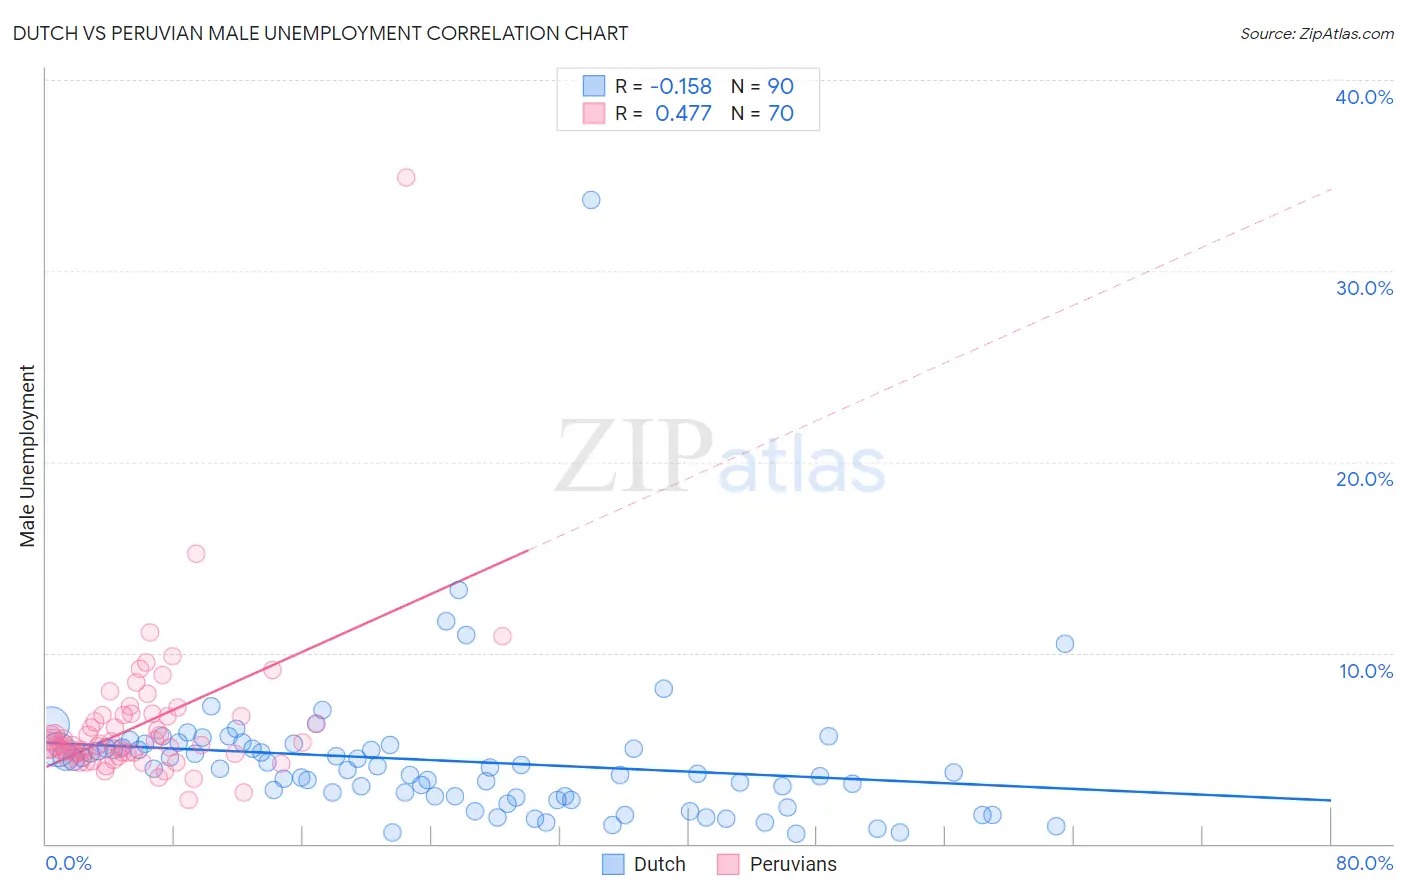
Dutch vs Peruvian Male Unemployment Correlation Chart
The statistical analysis conducted on geographies consisting of 544,964,773 people shows a poor negative correlation between the proportion of Dutch and unemployment rate among males in the United States with a correlation coefficient (R) of -0.158 and weighted average of 4.8%. Similarly, the statistical analysis conducted on geographies consisting of 362,248,150 people shows a moderate positive correlation between the proportion of Peruvians and unemployment rate among males in the United States with a correlation coefficient (R) of 0.477 and weighted average of 5.3%, a difference of 10.7%.
Male Unemployment Correlation Summary
| Measurement | Dutch | Peruvian |
| Minimum | 0.50% | 2.3% |
| Maximum | 33.7% | 34.9% |
| Range | 33.2% | 32.6% |
| Mean | 4.4% | 6.3% |
| Median | 3.9% | 5.2% |
| Interquartile 25% (IQ1) | 2.5% | 4.7% |
| Interquartile 75% (IQ3) | 5.1% | 6.7% |
| Interquartile Range (IQR) | 2.6% | 2.0% |
| Standard Deviation (Sample) | 3.9% | 4.1% |
| Standard Deviation (Population) | 3.9% | 4.0% |
Similar Demographics by Male Unemployment
Demographics Similar to Dutch by Male Unemployment
In terms of male unemployment, the demographic groups most similar to Dutch are Zimbabwean (4.8%, a difference of 0.020%), Immigrants from South Central Asia (4.8%, a difference of 0.12%), Tongan (4.8%, a difference of 0.15%), Carpatho Rusyn (4.8%, a difference of 0.20%), and Belgian (4.8%, a difference of 0.20%).
| Demographics | Rating | Rank | Male Unemployment |
| Europeans | 99.9 /100 | #19 | Exceptional 4.8% |
| Pennsylvania Germans | 99.9 /100 | #20 | Exceptional 4.8% |
| Immigrants | Taiwan | 99.9 /100 | #21 | Exceptional 4.8% |
| Carpatho Rusyns | 99.9 /100 | #22 | Exceptional 4.8% |
| Tongans | 99.9 /100 | #23 | Exceptional 4.8% |
| Immigrants | South Central Asia | 99.9 /100 | #24 | Exceptional 4.8% |
| Zimbabweans | 99.9 /100 | #25 | Exceptional 4.8% |
| Dutch | 99.9 /100 | #26 | Exceptional 4.8% |
| Belgians | 99.9 /100 | #27 | Exceptional 4.8% |
| Bulgarians | 99.8 /100 | #28 | Exceptional 4.8% |
| Scottish | 99.8 /100 | #29 | Exceptional 4.8% |
| British | 99.8 /100 | #30 | Exceptional 4.8% |
| Sudanese | 99.8 /100 | #31 | Exceptional 4.8% |
| Immigrants | Nepal | 99.8 /100 | #32 | Exceptional 4.8% |
| Latvians | 99.7 /100 | #33 | Exceptional 4.8% |
Demographics Similar to Peruvians by Male Unemployment
In terms of male unemployment, the demographic groups most similar to Peruvians are Immigrants from Kazakhstan (5.3%, a difference of 0.060%), Immigrants from Russia (5.3%, a difference of 0.070%), Immigrants from Iran (5.3%, a difference of 0.11%), Immigrants from Eastern Europe (5.3%, a difference of 0.13%), and Immigrants from Iraq (5.3%, a difference of 0.22%).
| Demographics | Rating | Rank | Male Unemployment |
| Afghans | 62.0 /100 | #164 | Good 5.3% |
| South Americans | 60.6 /100 | #165 | Good 5.3% |
| Immigrants | Morocco | 60.2 /100 | #166 | Good 5.3% |
| Immigrants | Vietnam | 58.1 /100 | #167 | Average 5.3% |
| Immigrants | Ireland | 57.7 /100 | #168 | Average 5.3% |
| Immigrants | Congo | 57.4 /100 | #169 | Average 5.3% |
| Immigrants | Eastern Europe | 54.1 /100 | #170 | Average 5.3% |
| Peruvians | 51.9 /100 | #171 | Average 5.3% |
| Immigrants | Kazakhstan | 50.8 /100 | #172 | Average 5.3% |
| Immigrants | Russia | 50.7 /100 | #173 | Average 5.3% |
| Immigrants | Iran | 50.0 /100 | #174 | Average 5.3% |
| Immigrants | Iraq | 48.1 /100 | #175 | Average 5.3% |
| Immigrants | Poland | 46.0 /100 | #176 | Average 5.3% |
| Immigrants | Peru | 44.6 /100 | #177 | Average 5.3% |
| Osage | 42.5 /100 | #178 | Average 5.3% |