Croatian vs Immigrants from Ethiopia Female Unemployment
COMPARE
Croatian
Immigrants from Ethiopia
Female Unemployment
Female Unemployment Comparison
Croatians
Immigrants from Ethiopia
4.7%
FEMALE UNEMPLOYMENT
99.9/ 100
METRIC RATING
17th/ 347
METRIC RANK
5.1%
FEMALE UNEMPLOYMENT
85.4/ 100
METRIC RATING
131st/ 347
METRIC RANK
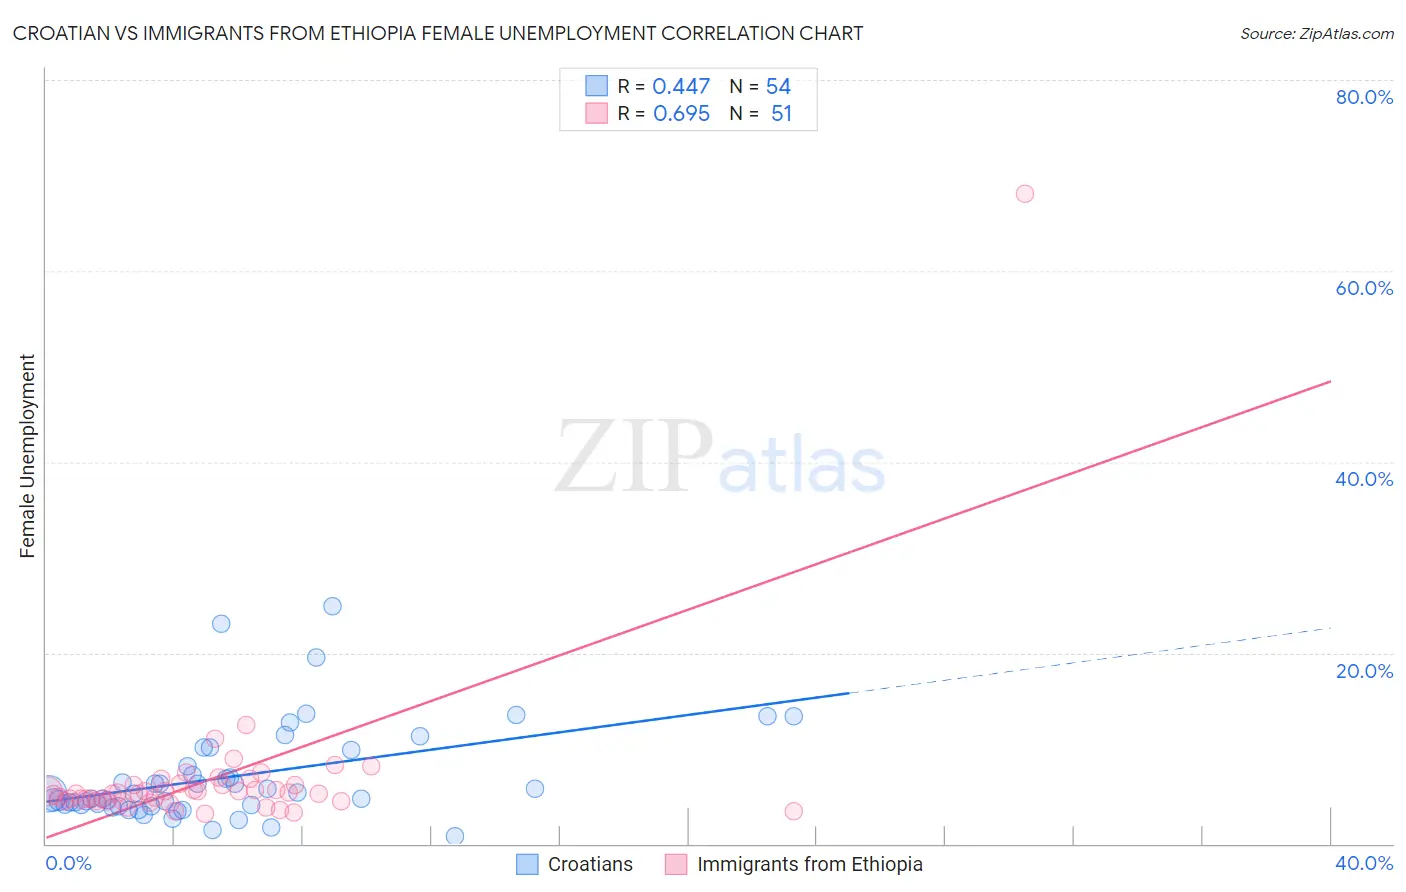
Croatian vs Immigrants from Ethiopia Female Unemployment Correlation Chart
The statistical analysis conducted on geographies consisting of 373,417,382 people shows a moderate positive correlation between the proportion of Croatians and unemploymnet rate among females in the United States with a correlation coefficient (R) of 0.447 and weighted average of 4.7%. Similarly, the statistical analysis conducted on geographies consisting of 211,284,920 people shows a significant positive correlation between the proportion of Immigrants from Ethiopia and unemploymnet rate among females in the United States with a correlation coefficient (R) of 0.695 and weighted average of 5.1%, a difference of 9.5%.
Female Unemployment Correlation Summary
| Measurement | Croatian | Immigrants from Ethiopia |
| Minimum | 0.80% | 3.1% |
| Maximum | 24.9% | 68.1% |
| Range | 24.1% | 65.0% |
| Mean | 6.9% | 6.8% |
| Median | 4.9% | 5.3% |
| Interquartile 25% (IQ1) | 4.1% | 4.5% |
| Interquartile 75% (IQ3) | 8.1% | 6.2% |
| Interquartile Range (IQR) | 4.0% | 1.7% |
| Standard Deviation (Sample) | 5.0% | 8.9% |
| Standard Deviation (Population) | 5.0% | 8.8% |
Similar Demographics by Female Unemployment
Demographics Similar to Croatians by Female Unemployment
In terms of female unemployment, the demographic groups most similar to Croatians are Carpatho Rusyn (4.7%, a difference of 0.020%), Latvian (4.7%, a difference of 0.14%), Polish (4.7%, a difference of 0.16%), Bulgarian (4.7%, a difference of 0.24%), and Fijian (4.7%, a difference of 0.25%).
| Demographics | Rating | Rank | Female Unemployment |
| Swiss | 100.0 /100 | #10 | Exceptional 4.6% |
| Scandinavians | 100.0 /100 | #11 | Exceptional 4.6% |
| Dutch | 100.0 /100 | #12 | Exceptional 4.6% |
| Belgians | 100.0 /100 | #13 | Exceptional 4.6% |
| Finns | 100.0 /100 | #14 | Exceptional 4.6% |
| English | 100.0 /100 | #15 | Exceptional 4.6% |
| Carpatho Rusyns | 99.9 /100 | #16 | Exceptional 4.7% |
| Croatians | 99.9 /100 | #17 | Exceptional 4.7% |
| Latvians | 99.9 /100 | #18 | Exceptional 4.7% |
| Poles | 99.9 /100 | #19 | Exceptional 4.7% |
| Bulgarians | 99.9 /100 | #20 | Exceptional 4.7% |
| Fijians | 99.9 /100 | #21 | Exceptional 4.7% |
| Europeans | 99.9 /100 | #22 | Exceptional 4.7% |
| Scottish | 99.9 /100 | #23 | Exceptional 4.7% |
| Welsh | 99.9 /100 | #24 | Exceptional 4.7% |
Demographics Similar to Immigrants from Ethiopia by Female Unemployment
In terms of female unemployment, the demographic groups most similar to Immigrants from Ethiopia are Maltese (5.1%, a difference of 0.020%), Ethiopian (5.1%, a difference of 0.050%), Immigrants from Sri Lanka (5.1%, a difference of 0.050%), Chilean (5.1%, a difference of 0.060%), and Immigrants from Hong Kong (5.1%, a difference of 0.070%).
| Demographics | Rating | Rank | Female Unemployment |
| Immigrants | Europe | 87.2 /100 | #124 | Excellent 5.1% |
| Basques | 86.5 /100 | #125 | Excellent 5.1% |
| Immigrants | Korea | 86.3 /100 | #126 | Excellent 5.1% |
| Immigrants | Hungary | 86.0 /100 | #127 | Excellent 5.1% |
| Chileans | 85.8 /100 | #128 | Excellent 5.1% |
| Ethiopians | 85.7 /100 | #129 | Excellent 5.1% |
| Maltese | 85.5 /100 | #130 | Excellent 5.1% |
| Immigrants | Ethiopia | 85.4 /100 | #131 | Excellent 5.1% |
| Immigrants | Sri Lanka | 85.0 /100 | #132 | Excellent 5.1% |
| Immigrants | Hong Kong | 84.8 /100 | #133 | Excellent 5.1% |
| Immigrants | Eritrea | 84.6 /100 | #134 | Excellent 5.1% |
| Immigrants | Latvia | 84.6 /100 | #135 | Excellent 5.1% |
| Indians (Asian) | 84.2 /100 | #136 | Excellent 5.1% |
| Pakistanis | 83.8 /100 | #137 | Excellent 5.1% |
| Chickasaw | 83.2 /100 | #138 | Excellent 5.1% |