Nigerian vs British West Indian Female Unemployment
COMPARE
Nigerian
British West Indian
Female Unemployment
Female Unemployment Comparison
Nigerians
British West Indians
5.8%
FEMALE UNEMPLOYMENT
0.2/ 100
METRIC RATING
260th/ 347
METRIC RANK
6.4%
FEMALE UNEMPLOYMENT
0.0/ 100
METRIC RATING
318th/ 347
METRIC RANK
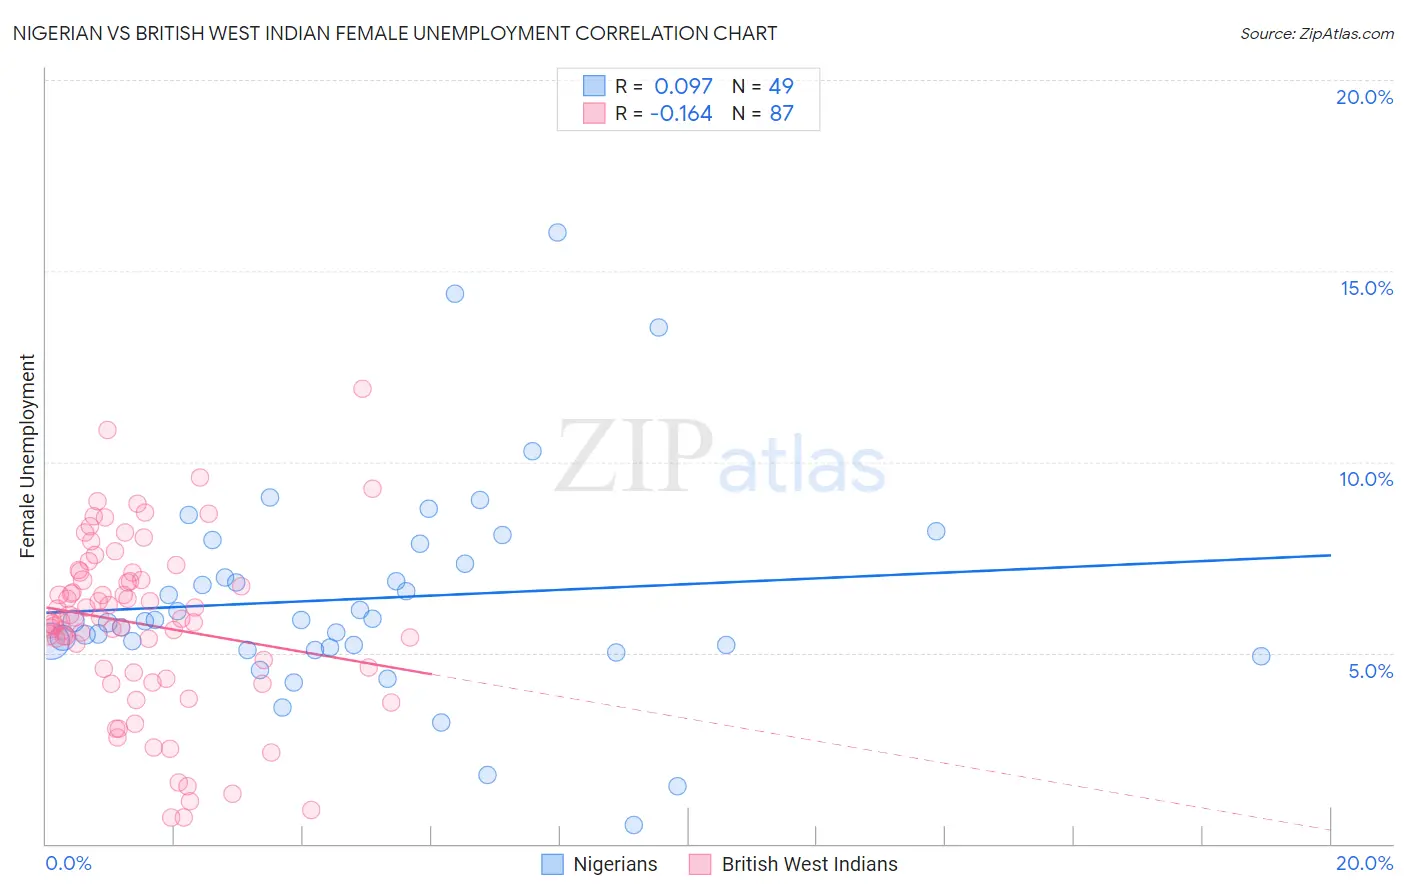
Nigerian vs British West Indian Female Unemployment Correlation Chart
The statistical analysis conducted on geographies consisting of 332,062,717 people shows a slight positive correlation between the proportion of Nigerians and unemploymnet rate among females in the United States with a correlation coefficient (R) of 0.097 and weighted average of 5.8%. Similarly, the statistical analysis conducted on geographies consisting of 152,545,495 people shows a poor negative correlation between the proportion of British West Indians and unemploymnet rate among females in the United States with a correlation coefficient (R) of -0.164 and weighted average of 6.4%, a difference of 11.9%.
Female Unemployment Correlation Summary
| Measurement | Nigerian | British West Indian |
| Minimum | 0.50% | 0.70% |
| Maximum | 16.0% | 11.9% |
| Range | 15.5% | 11.2% |
| Mean | 6.4% | 5.8% |
| Median | 5.8% | 5.9% |
| Interquartile 25% (IQ1) | 5.1% | 4.5% |
| Interquartile 75% (IQ3) | 7.6% | 7.1% |
| Interquartile Range (IQR) | 2.5% | 2.6% |
| Standard Deviation (Sample) | 2.9% | 2.3% |
| Standard Deviation (Population) | 2.8% | 2.3% |
Similar Demographics by Female Unemployment
Demographics Similar to Nigerians by Female Unemployment
In terms of female unemployment, the demographic groups most similar to Nigerians are Immigrants from Fiji (5.8%, a difference of 0.040%), Immigrants from Portugal (5.8%, a difference of 0.14%), Kiowa (5.8%, a difference of 0.26%), Immigrants from Nigeria (5.8%, a difference of 0.30%), and Dutch West Indian (5.7%, a difference of 0.95%).
| Demographics | Rating | Rank | Female Unemployment |
| Immigrants | Sierra Leone | 0.6 /100 | #253 | Tragic 5.7% |
| Immigrants | Immigrants | 0.6 /100 | #254 | Tragic 5.7% |
| Immigrants | Cameroon | 0.6 /100 | #255 | Tragic 5.7% |
| Sub-Saharan Africans | 0.4 /100 | #256 | Tragic 5.7% |
| Dutch West Indians | 0.3 /100 | #257 | Tragic 5.7% |
| Immigrants | Portugal | 0.2 /100 | #258 | Tragic 5.8% |
| Immigrants | Fiji | 0.2 /100 | #259 | Tragic 5.8% |
| Nigerians | 0.2 /100 | #260 | Tragic 5.8% |
| Kiowa | 0.1 /100 | #261 | Tragic 5.8% |
| Immigrants | Nigeria | 0.1 /100 | #262 | Tragic 5.8% |
| Immigrants | Azores | 0.1 /100 | #263 | Tragic 5.8% |
| Immigrants | Bahamas | 0.1 /100 | #264 | Tragic 5.8% |
| Blackfeet | 0.0 /100 | #265 | Tragic 5.9% |
| Cape Verdeans | 0.0 /100 | #266 | Tragic 5.9% |
| Nepalese | 0.0 /100 | #267 | Tragic 5.9% |
Demographics Similar to British West Indians by Female Unemployment
In terms of female unemployment, the demographic groups most similar to British West Indians are Immigrants from Bangladesh (6.5%, a difference of 0.19%), Immigrants from Dominica (6.5%, a difference of 0.20%), Immigrants from St. Vincent and the Grenadines (6.4%, a difference of 0.28%), Houma (6.4%, a difference of 0.73%), and Black/African American (6.5%, a difference of 0.74%).
| Demographics | Rating | Rank | Female Unemployment |
| Immigrants | Mexico | 0.0 /100 | #311 | Tragic 6.3% |
| Immigrants | Grenada | 0.0 /100 | #312 | Tragic 6.3% |
| Belizeans | 0.0 /100 | #313 | Tragic 6.3% |
| Immigrants | Ecuador | 0.0 /100 | #314 | Tragic 6.4% |
| Pueblo | 0.0 /100 | #315 | Tragic 6.4% |
| Houma | 0.0 /100 | #316 | Tragic 6.4% |
| Immigrants | St. Vincent and the Grenadines | 0.0 /100 | #317 | Tragic 6.4% |
| British West Indians | 0.0 /100 | #318 | Tragic 6.4% |
| Immigrants | Bangladesh | 0.0 /100 | #319 | Tragic 6.5% |
| Immigrants | Dominica | 0.0 /100 | #320 | Tragic 6.5% |
| Blacks/African Americans | 0.0 /100 | #321 | Tragic 6.5% |
| Vietnamese | 0.0 /100 | #322 | Tragic 6.5% |
| Immigrants | Belize | 0.0 /100 | #323 | Tragic 6.5% |
| Cheyenne | 0.0 /100 | #324 | Tragic 6.6% |
| Apache | 0.0 /100 | #325 | Tragic 6.6% |