Croatian vs Immigrants from Latin America Female Unemployment
COMPARE
Croatian
Immigrants from Latin America
Female Unemployment
Female Unemployment Comparison
Croatians
Immigrants from Latin America
4.7%
FEMALE UNEMPLOYMENT
99.9/ 100
METRIC RATING
17th/ 347
METRIC RANK
6.1%
FEMALE UNEMPLOYMENT
0.0/ 100
METRIC RATING
295th/ 347
METRIC RANK
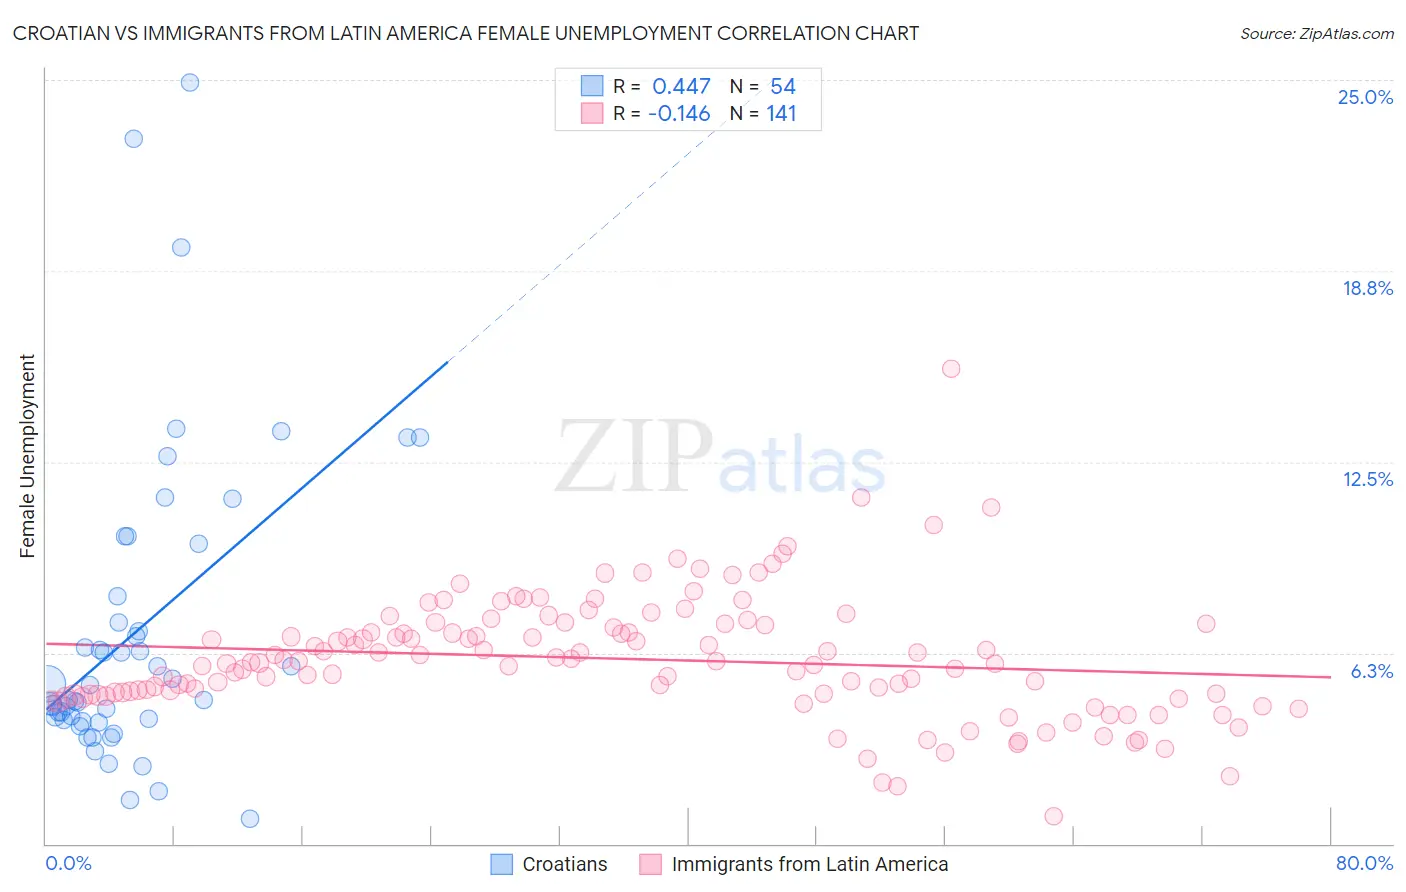
Croatian vs Immigrants from Latin America Female Unemployment Correlation Chart
The statistical analysis conducted on geographies consisting of 373,417,382 people shows a moderate positive correlation between the proportion of Croatians and unemploymnet rate among females in the United States with a correlation coefficient (R) of 0.447 and weighted average of 4.7%. Similarly, the statistical analysis conducted on geographies consisting of 548,551,926 people shows a poor negative correlation between the proportion of Immigrants from Latin America and unemploymnet rate among females in the United States with a correlation coefficient (R) of -0.146 and weighted average of 6.1%, a difference of 30.9%.
Female Unemployment Correlation Summary
| Measurement | Croatian | Immigrants from Latin America |
| Minimum | 0.80% | 0.90% |
| Maximum | 24.9% | 15.5% |
| Range | 24.1% | 14.6% |
| Mean | 6.9% | 6.1% |
| Median | 4.9% | 6.0% |
| Interquartile 25% (IQ1) | 4.1% | 4.9% |
| Interquartile 75% (IQ3) | 8.1% | 7.2% |
| Interquartile Range (IQR) | 4.0% | 2.3% |
| Standard Deviation (Sample) | 5.0% | 2.0% |
| Standard Deviation (Population) | 5.0% | 2.0% |
Similar Demographics by Female Unemployment
Demographics Similar to Croatians by Female Unemployment
In terms of female unemployment, the demographic groups most similar to Croatians are Carpatho Rusyn (4.7%, a difference of 0.020%), Latvian (4.7%, a difference of 0.14%), Polish (4.7%, a difference of 0.16%), Bulgarian (4.7%, a difference of 0.24%), and Fijian (4.7%, a difference of 0.25%).
| Demographics | Rating | Rank | Female Unemployment |
| Swiss | 100.0 /100 | #10 | Exceptional 4.6% |
| Scandinavians | 100.0 /100 | #11 | Exceptional 4.6% |
| Dutch | 100.0 /100 | #12 | Exceptional 4.6% |
| Belgians | 100.0 /100 | #13 | Exceptional 4.6% |
| Finns | 100.0 /100 | #14 | Exceptional 4.6% |
| English | 100.0 /100 | #15 | Exceptional 4.6% |
| Carpatho Rusyns | 99.9 /100 | #16 | Exceptional 4.7% |
| Croatians | 99.9 /100 | #17 | Exceptional 4.7% |
| Latvians | 99.9 /100 | #18 | Exceptional 4.7% |
| Poles | 99.9 /100 | #19 | Exceptional 4.7% |
| Bulgarians | 99.9 /100 | #20 | Exceptional 4.7% |
| Fijians | 99.9 /100 | #21 | Exceptional 4.7% |
| Europeans | 99.9 /100 | #22 | Exceptional 4.7% |
| Scottish | 99.9 /100 | #23 | Exceptional 4.7% |
| Welsh | 99.9 /100 | #24 | Exceptional 4.7% |
Demographics Similar to Immigrants from Latin America by Female Unemployment
In terms of female unemployment, the demographic groups most similar to Immigrants from Latin America are Alaskan Athabascan (6.1%, a difference of 0.020%), West Indian (6.1%, a difference of 0.030%), Jamaican (6.1%, a difference of 0.050%), Immigrants from El Salvador (6.1%, a difference of 0.10%), and Ute (6.1%, a difference of 0.16%).
| Demographics | Rating | Rank | Female Unemployment |
| Haitians | 0.0 /100 | #288 | Tragic 6.1% |
| Trinidadians and Tobagonians | 0.0 /100 | #289 | Tragic 6.1% |
| Immigrants | Caribbean | 0.0 /100 | #290 | Tragic 6.1% |
| Immigrants | West Indies | 0.0 /100 | #291 | Tragic 6.1% |
| Immigrants | Trinidad and Tobago | 0.0 /100 | #292 | Tragic 6.1% |
| Mexicans | 0.0 /100 | #293 | Tragic 6.1% |
| Immigrants | El Salvador | 0.0 /100 | #294 | Tragic 6.1% |
| Immigrants | Latin America | 0.0 /100 | #295 | Tragic 6.1% |
| Alaskan Athabascans | 0.0 /100 | #296 | Tragic 6.1% |
| West Indians | 0.0 /100 | #297 | Tragic 6.1% |
| Jamaicans | 0.0 /100 | #298 | Tragic 6.1% |
| Ute | 0.0 /100 | #299 | Tragic 6.1% |
| Immigrants | Haiti | 0.0 /100 | #300 | Tragic 6.1% |
| Immigrants | Barbados | 0.0 /100 | #301 | Tragic 6.2% |
| U.S. Virgin Islanders | 0.0 /100 | #302 | Tragic 6.2% |