Croatian vs Immigrants from Colombia Female Unemployment
COMPARE
Croatian
Immigrants from Colombia
Female Unemployment
Female Unemployment Comparison
Croatians
Immigrants from Colombia
4.7%
FEMALE UNEMPLOYMENT
99.9/ 100
METRIC RATING
17th/ 347
METRIC RANK
5.3%
FEMALE UNEMPLOYMENT
26.2/ 100
METRIC RATING
195th/ 347
METRIC RANK
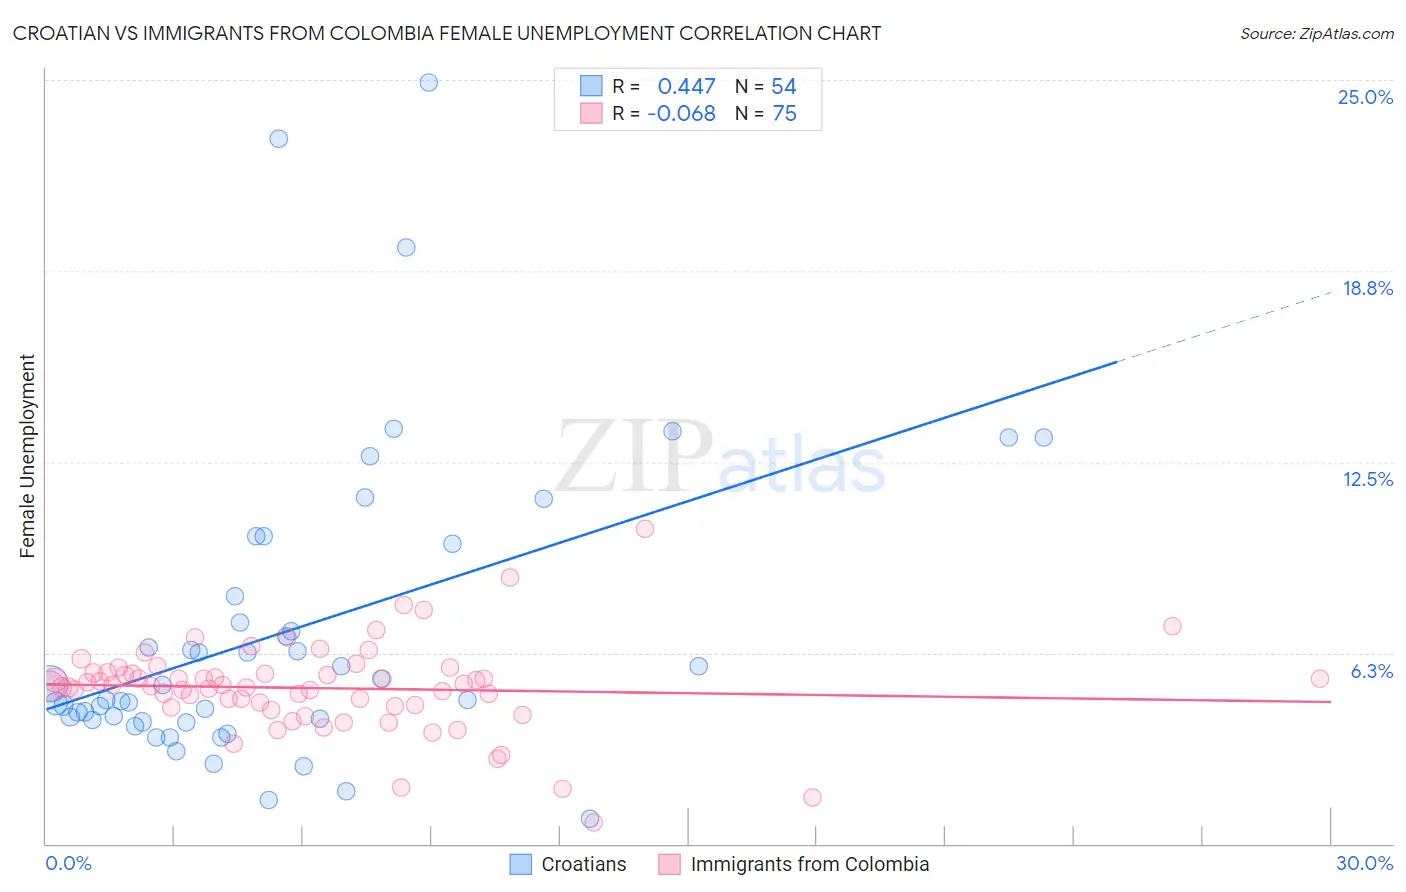
Croatian vs Immigrants from Colombia Female Unemployment Correlation Chart
The statistical analysis conducted on geographies consisting of 373,417,382 people shows a moderate positive correlation between the proportion of Croatians and unemploymnet rate among females in the United States with a correlation coefficient (R) of 0.447 and weighted average of 4.7%. Similarly, the statistical analysis conducted on geographies consisting of 377,421,929 people shows a slight negative correlation between the proportion of Immigrants from Colombia and unemploymnet rate among females in the United States with a correlation coefficient (R) of -0.068 and weighted average of 5.3%, a difference of 14.2%.
Female Unemployment Correlation Summary
| Measurement | Croatian | Immigrants from Colombia |
| Minimum | 0.80% | 0.70% |
| Maximum | 24.9% | 10.3% |
| Range | 24.1% | 9.6% |
| Mean | 6.9% | 5.1% |
| Median | 4.9% | 5.2% |
| Interquartile 25% (IQ1) | 4.1% | 4.5% |
| Interquartile 75% (IQ3) | 8.1% | 5.6% |
| Interquartile Range (IQR) | 4.0% | 1.1% |
| Standard Deviation (Sample) | 5.0% | 1.5% |
| Standard Deviation (Population) | 5.0% | 1.5% |
Similar Demographics by Female Unemployment
Demographics Similar to Croatians by Female Unemployment
In terms of female unemployment, the demographic groups most similar to Croatians are Carpatho Rusyn (4.7%, a difference of 0.020%), Latvian (4.7%, a difference of 0.14%), Polish (4.7%, a difference of 0.16%), Bulgarian (4.7%, a difference of 0.24%), and Fijian (4.7%, a difference of 0.25%).
| Demographics | Rating | Rank | Female Unemployment |
| Swiss | 100.0 /100 | #10 | Exceptional 4.6% |
| Scandinavians | 100.0 /100 | #11 | Exceptional 4.6% |
| Dutch | 100.0 /100 | #12 | Exceptional 4.6% |
| Belgians | 100.0 /100 | #13 | Exceptional 4.6% |
| Finns | 100.0 /100 | #14 | Exceptional 4.6% |
| English | 100.0 /100 | #15 | Exceptional 4.6% |
| Carpatho Rusyns | 99.9 /100 | #16 | Exceptional 4.7% |
| Croatians | 99.9 /100 | #17 | Exceptional 4.7% |
| Latvians | 99.9 /100 | #18 | Exceptional 4.7% |
| Poles | 99.9 /100 | #19 | Exceptional 4.7% |
| Bulgarians | 99.9 /100 | #20 | Exceptional 4.7% |
| Fijians | 99.9 /100 | #21 | Exceptional 4.7% |
| Europeans | 99.9 /100 | #22 | Exceptional 4.7% |
| Scottish | 99.9 /100 | #23 | Exceptional 4.7% |
| Welsh | 99.9 /100 | #24 | Exceptional 4.7% |
Demographics Similar to Immigrants from Colombia by Female Unemployment
In terms of female unemployment, the demographic groups most similar to Immigrants from Colombia are Colombian (5.3%, a difference of 0.060%), Spaniard (5.3%, a difference of 0.080%), Arab (5.3%, a difference of 0.11%), Portuguese (5.3%, a difference of 0.18%), and Alsatian (5.3%, a difference of 0.18%).
| Demographics | Rating | Rank | Female Unemployment |
| Afghans | 33.9 /100 | #188 | Fair 5.3% |
| Costa Ricans | 33.8 /100 | #189 | Fair 5.3% |
| Ugandans | 31.2 /100 | #190 | Fair 5.3% |
| Cherokee | 30.8 /100 | #191 | Fair 5.3% |
| Portuguese | 28.6 /100 | #192 | Fair 5.3% |
| Arabs | 27.7 /100 | #193 | Fair 5.3% |
| Colombians | 27.0 /100 | #194 | Fair 5.3% |
| Immigrants | Colombia | 26.2 /100 | #195 | Fair 5.3% |
| Spaniards | 25.2 /100 | #196 | Fair 5.3% |
| Alsatians | 23.9 /100 | #197 | Fair 5.3% |
| Tsimshian | 23.1 /100 | #198 | Fair 5.4% |
| Hawaiians | 22.2 /100 | #199 | Fair 5.4% |
| Soviet Union | 21.7 /100 | #200 | Fair 5.4% |
| Immigrants | Middle Africa | 20.8 /100 | #201 | Fair 5.4% |
| Iroquois | 20.8 /100 | #202 | Fair 5.4% |