Immigrants from Western Europe vs Immigrants from Ethiopia Male Unemployment
COMPARE
Immigrants from Western Europe
Immigrants from Ethiopia
Male Unemployment
Male Unemployment Comparison
Immigrants from Western Europe
Immigrants from Ethiopia
5.2%
MALE UNEMPLOYMENT
84.8/ 100
METRIC RATING
129th/ 347
METRIC RANK
5.1%
MALE UNEMPLOYMENT
91.5/ 100
METRIC RATING
106th/ 347
METRIC RANK
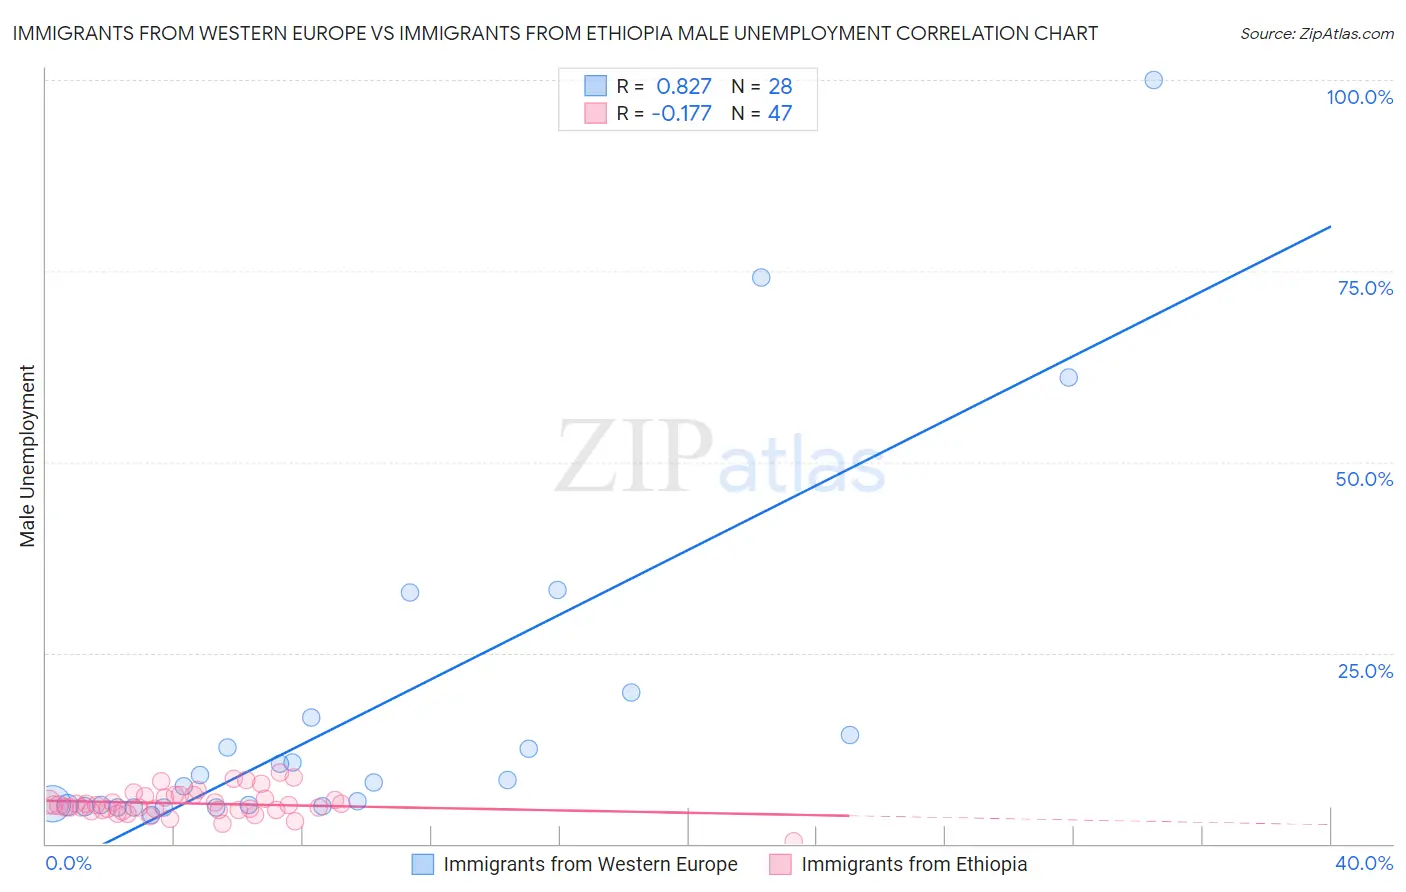
Immigrants from Western Europe vs Immigrants from Ethiopia Male Unemployment Correlation Chart
The statistical analysis conducted on geographies consisting of 490,157,705 people shows a very strong positive correlation between the proportion of Immigrants from Western Europe and unemployment rate among males in the United States with a correlation coefficient (R) of 0.827 and weighted average of 5.2%. Similarly, the statistical analysis conducted on geographies consisting of 211,215,885 people shows a poor negative correlation between the proportion of Immigrants from Ethiopia and unemployment rate among males in the United States with a correlation coefficient (R) of -0.177 and weighted average of 5.1%, a difference of 0.99%.
Male Unemployment Correlation Summary
| Measurement | Immigrants from Western Europe | Immigrants from Ethiopia |
| Minimum | 3.8% | 0.40% |
| Maximum | 100.0% | 9.4% |
| Range | 96.2% | 9.0% |
| Mean | 17.5% | 5.3% |
| Median | 8.2% | 5.1% |
| Interquartile 25% (IQ1) | 4.9% | 4.4% |
| Interquartile 75% (IQ3) | 15.4% | 6.2% |
| Interquartile Range (IQR) | 10.4% | 1.8% |
| Standard Deviation (Sample) | 23.4% | 1.7% |
| Standard Deviation (Population) | 23.0% | 1.7% |
Similar Demographics by Male Unemployment
Demographics Similar to Immigrants from Western Europe by Male Unemployment
In terms of male unemployment, the demographic groups most similar to Immigrants from Western Europe are Hungarian (5.2%, a difference of 0.030%), Immigrants from Malaysia (5.2%, a difference of 0.15%), Immigrants from Brazil (5.2%, a difference of 0.18%), Immigrants from Germany (5.2%, a difference of 0.20%), and Chickasaw (5.2%, a difference of 0.21%).
| Demographics | Rating | Rank | Male Unemployment |
| Nicaraguans | 88.2 /100 | #122 | Excellent 5.1% |
| Palestinians | 87.7 /100 | #123 | Excellent 5.1% |
| Immigrants | Latvia | 87.5 /100 | #124 | Excellent 5.1% |
| Immigrants | Lithuania | 87.2 /100 | #125 | Excellent 5.1% |
| Immigrants | Colombia | 86.8 /100 | #126 | Excellent 5.1% |
| Immigrants | Brazil | 86.3 /100 | #127 | Excellent 5.2% |
| Hungarians | 85.1 /100 | #128 | Excellent 5.2% |
| Immigrants | Western Europe | 84.8 /100 | #129 | Excellent 5.2% |
| Immigrants | Malaysia | 83.5 /100 | #130 | Excellent 5.2% |
| Immigrants | Germany | 83.0 /100 | #131 | Excellent 5.2% |
| Chickasaw | 82.9 /100 | #132 | Excellent 5.2% |
| Colombians | 81.1 /100 | #133 | Excellent 5.2% |
| Pakistanis | 80.5 /100 | #134 | Excellent 5.2% |
| Immigrants | Saudi Arabia | 80.1 /100 | #135 | Excellent 5.2% |
| Lebanese | 79.9 /100 | #136 | Good 5.2% |
Demographics Similar to Immigrants from Ethiopia by Male Unemployment
In terms of male unemployment, the demographic groups most similar to Immigrants from Ethiopia are Immigrants from Czechoslovakia (5.1%, a difference of 0.040%), Ethiopian (5.1%, a difference of 0.040%), Immigrants from Chile (5.1%, a difference of 0.050%), Immigrants from Nicaragua (5.1%, a difference of 0.050%), and Immigrants from Jordan (5.1%, a difference of 0.080%).
| Demographics | Rating | Rank | Male Unemployment |
| Uruguayans | 93.0 /100 | #99 | Exceptional 5.1% |
| Russians | 92.9 /100 | #100 | Exceptional 5.1% |
| German Russians | 92.7 /100 | #101 | Exceptional 5.1% |
| Immigrants | France | 92.7 /100 | #102 | Exceptional 5.1% |
| Immigrants | Jordan | 91.9 /100 | #103 | Exceptional 5.1% |
| Immigrants | Chile | 91.8 /100 | #104 | Exceptional 5.1% |
| Immigrants | Czechoslovakia | 91.7 /100 | #105 | Exceptional 5.1% |
| Immigrants | Ethiopia | 91.5 /100 | #106 | Exceptional 5.1% |
| Ethiopians | 91.3 /100 | #107 | Exceptional 5.1% |
| Immigrants | Nicaragua | 91.2 /100 | #108 | Exceptional 5.1% |
| Immigrants | Pakistan | 90.9 /100 | #109 | Exceptional 5.1% |
| Immigrants | England | 90.8 /100 | #110 | Exceptional 5.1% |
| Immigrants | Eastern Asia | 90.8 /100 | #111 | Exceptional 5.1% |
| Immigrants | Moldova | 90.3 /100 | #112 | Exceptional 5.1% |
| Immigrants | Austria | 90.3 /100 | #113 | Exceptional 5.1% |