Native/Alaskan vs Immigrants from Ethiopia Male Unemployment
COMPARE
Native/Alaskan
Immigrants from Ethiopia
Male Unemployment
Male Unemployment Comparison
Natives/Alaskans
Immigrants from Ethiopia
7.7%
MALE UNEMPLOYMENT
0.0/ 100
METRIC RATING
328th/ 347
METRIC RANK
5.1%
MALE UNEMPLOYMENT
91.5/ 100
METRIC RATING
106th/ 347
METRIC RANK
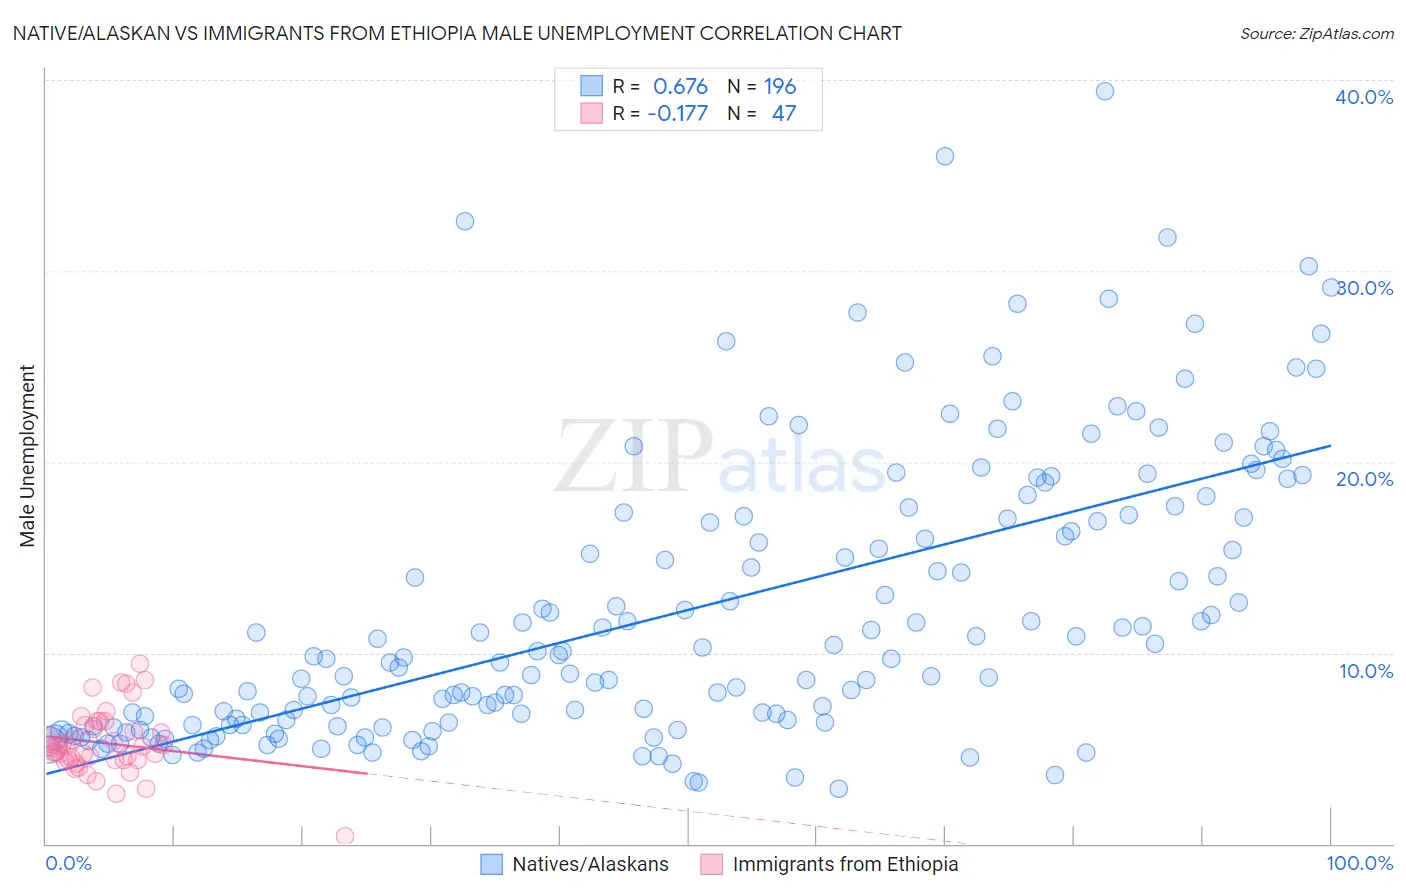
Native/Alaskan vs Immigrants from Ethiopia Male Unemployment Correlation Chart
The statistical analysis conducted on geographies consisting of 507,569,897 people shows a significant positive correlation between the proportion of Natives/Alaskans and unemployment rate among males in the United States with a correlation coefficient (R) of 0.676 and weighted average of 7.7%. Similarly, the statistical analysis conducted on geographies consisting of 211,215,885 people shows a poor negative correlation between the proportion of Immigrants from Ethiopia and unemployment rate among males in the United States with a correlation coefficient (R) of -0.177 and weighted average of 5.1%, a difference of 51.0%.
Male Unemployment Correlation Summary
| Measurement | Native/Alaskan | Immigrants from Ethiopia |
| Minimum | 2.9% | 0.40% |
| Maximum | 39.4% | 9.4% |
| Range | 36.5% | 9.0% |
| Mean | 12.2% | 5.3% |
| Median | 9.7% | 5.1% |
| Interquartile 25% (IQ1) | 6.2% | 4.4% |
| Interquartile 75% (IQ3) | 17.1% | 6.2% |
| Interquartile Range (IQR) | 10.9% | 1.8% |
| Standard Deviation (Sample) | 7.4% | 1.7% |
| Standard Deviation (Population) | 7.4% | 1.7% |
Similar Demographics by Male Unemployment
Demographics Similar to Natives/Alaskans by Male Unemployment
In terms of male unemployment, the demographic groups most similar to Natives/Alaskans are Paiute (7.7%, a difference of 0.38%), Immigrants from Yemen (7.8%, a difference of 0.90%), Immigrants from Dominican Republic (7.6%, a difference of 1.5%), Shoshone (7.6%, a difference of 1.6%), and Dominican (7.6%, a difference of 2.0%).
| Demographics | Rating | Rank | Male Unemployment |
| Immigrants | St. Vincent and the Grenadines | 0.0 /100 | #321 | Tragic 7.5% |
| Immigrants | Cabo Verde | 0.0 /100 | #322 | Tragic 7.5% |
| Immigrants | Grenada | 0.0 /100 | #323 | Tragic 7.6% |
| Dominicans | 0.0 /100 | #324 | Tragic 7.6% |
| Shoshone | 0.0 /100 | #325 | Tragic 7.6% |
| Immigrants | Dominican Republic | 0.0 /100 | #326 | Tragic 7.6% |
| Paiute | 0.0 /100 | #327 | Tragic 7.7% |
| Natives/Alaskans | 0.0 /100 | #328 | Tragic 7.7% |
| Immigrants | Yemen | 0.0 /100 | #329 | Tragic 7.8% |
| Yakama | 0.0 /100 | #330 | Tragic 7.9% |
| Alaska Natives | 0.0 /100 | #331 | Tragic 8.1% |
| Pima | 0.0 /100 | #332 | Tragic 8.3% |
| Sioux | 0.0 /100 | #333 | Tragic 8.4% |
| Tsimshian | 0.0 /100 | #334 | Tragic 8.5% |
| Pueblo | 0.0 /100 | #335 | Tragic 8.5% |
Demographics Similar to Immigrants from Ethiopia by Male Unemployment
In terms of male unemployment, the demographic groups most similar to Immigrants from Ethiopia are Immigrants from Czechoslovakia (5.1%, a difference of 0.040%), Ethiopian (5.1%, a difference of 0.040%), Immigrants from Chile (5.1%, a difference of 0.050%), Immigrants from Nicaragua (5.1%, a difference of 0.050%), and Immigrants from Jordan (5.1%, a difference of 0.080%).
| Demographics | Rating | Rank | Male Unemployment |
| Uruguayans | 93.0 /100 | #99 | Exceptional 5.1% |
| Russians | 92.9 /100 | #100 | Exceptional 5.1% |
| German Russians | 92.7 /100 | #101 | Exceptional 5.1% |
| Immigrants | France | 92.7 /100 | #102 | Exceptional 5.1% |
| Immigrants | Jordan | 91.9 /100 | #103 | Exceptional 5.1% |
| Immigrants | Chile | 91.8 /100 | #104 | Exceptional 5.1% |
| Immigrants | Czechoslovakia | 91.7 /100 | #105 | Exceptional 5.1% |
| Immigrants | Ethiopia | 91.5 /100 | #106 | Exceptional 5.1% |
| Ethiopians | 91.3 /100 | #107 | Exceptional 5.1% |
| Immigrants | Nicaragua | 91.2 /100 | #108 | Exceptional 5.1% |
| Immigrants | Pakistan | 90.9 /100 | #109 | Exceptional 5.1% |
| Immigrants | England | 90.8 /100 | #110 | Exceptional 5.1% |
| Immigrants | Eastern Asia | 90.8 /100 | #111 | Exceptional 5.1% |
| Immigrants | Moldova | 90.3 /100 | #112 | Exceptional 5.1% |
| Immigrants | Austria | 90.3 /100 | #113 | Exceptional 5.1% |