Creek vs Immigrants from Ethiopia Nursery School
COMPARE
Creek
Immigrants from Ethiopia
Nursery School
Nursery School Comparison
Creek
Immigrants from Ethiopia
98.4%
NURSERY SCHOOL
99.7/ 100
METRIC RATING
62nd/ 347
METRIC RANK
97.6%
NURSERY SCHOOL
0.4/ 100
METRIC RATING
262nd/ 347
METRIC RANK
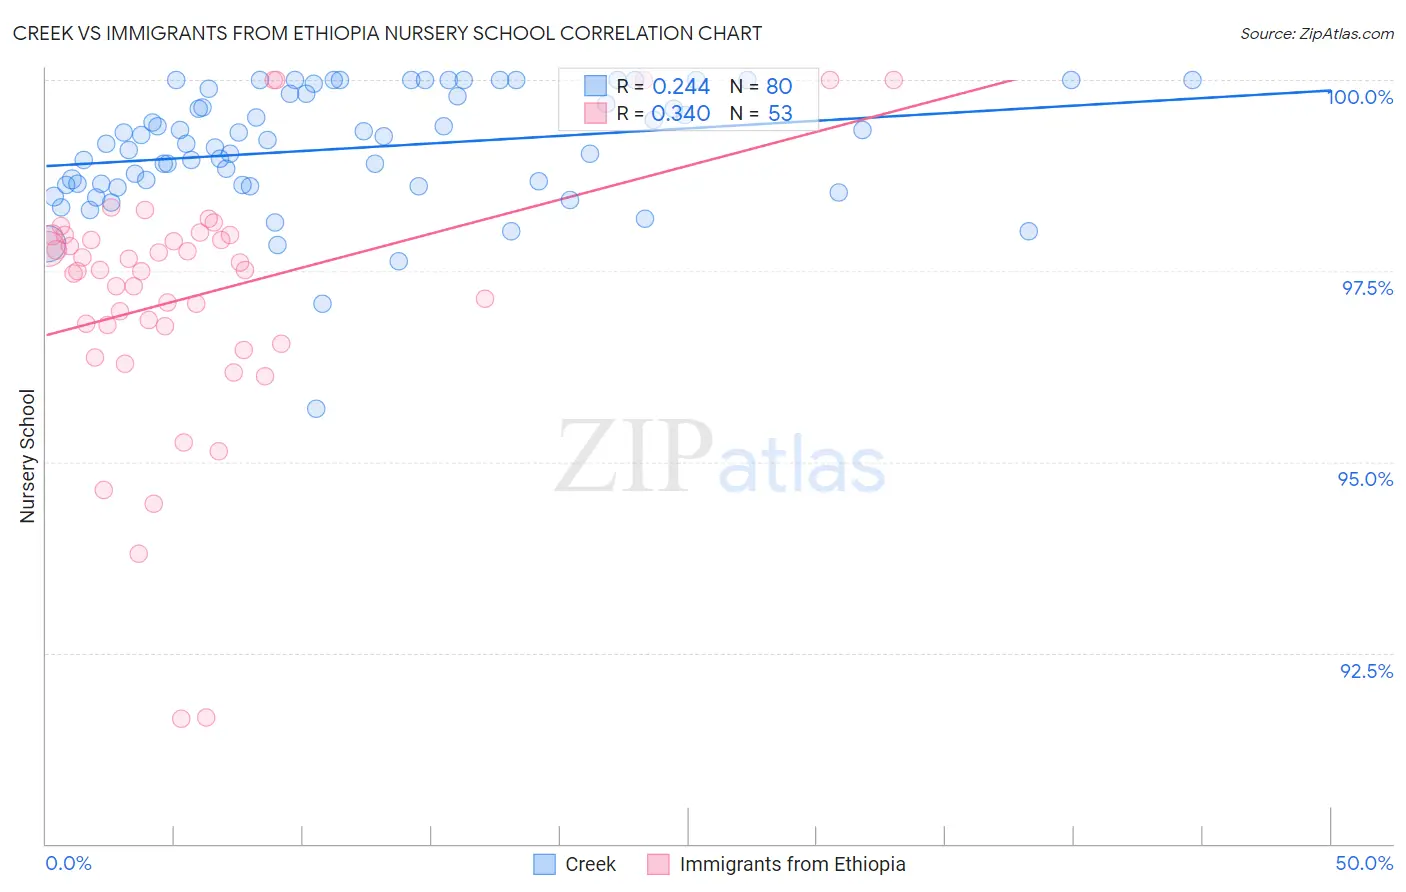
Creek vs Immigrants from Ethiopia Nursery School Correlation Chart
The statistical analysis conducted on geographies consisting of 178,480,663 people shows a weak positive correlation between the proportion of Creek and percentage of population with at least nursery school education in the United States with a correlation coefficient (R) of 0.244 and weighted average of 98.4%. Similarly, the statistical analysis conducted on geographies consisting of 211,539,400 people shows a mild positive correlation between the proportion of Immigrants from Ethiopia and percentage of population with at least nursery school education in the United States with a correlation coefficient (R) of 0.340 and weighted average of 97.6%, a difference of 0.87%.
Nursery School Correlation Summary
| Measurement | Creek | Immigrants from Ethiopia |
| Minimum | 95.7% | 91.6% |
| Maximum | 100.0% | 100.0% |
| Range | 4.3% | 8.4% |
| Mean | 99.1% | 97.2% |
| Median | 99.2% | 97.5% |
| Interquartile 25% (IQ1) | 98.6% | 96.7% |
| Interquartile 75% (IQ3) | 99.8% | 98.0% |
| Interquartile Range (IQR) | 1.2% | 1.3% |
| Standard Deviation (Sample) | 0.79% | 1.7% |
| Standard Deviation (Population) | 0.79% | 1.7% |
Similar Demographics by Nursery School
Demographics Similar to Creek by Nursery School
In terms of nursery school, the demographic groups most similar to Creek are Immigrants from Canada (98.4%, a difference of 0.0%), Slavic (98.4%, a difference of 0.0%), New Zealander (98.4%, a difference of 0.0%), Immigrants from North America (98.4%, a difference of 0.0%), and Greek (98.4%, a difference of 0.0%).
| Demographics | Rating | Rank | Nursery School |
| Immigrants | Scotland | 99.8 /100 | #55 | Exceptional 98.4% |
| Americans | 99.8 /100 | #56 | Exceptional 98.4% |
| Austrians | 99.8 /100 | #57 | Exceptional 98.4% |
| Bulgarians | 99.8 /100 | #58 | Exceptional 98.4% |
| Immigrants | Canada | 99.8 /100 | #59 | Exceptional 98.4% |
| Slavs | 99.8 /100 | #60 | Exceptional 98.4% |
| New Zealanders | 99.7 /100 | #61 | Exceptional 98.4% |
| Creek | 99.7 /100 | #62 | Exceptional 98.4% |
| Immigrants | North America | 99.7 /100 | #63 | Exceptional 98.4% |
| Greeks | 99.7 /100 | #64 | Exceptional 98.4% |
| Maltese | 99.7 /100 | #65 | Exceptional 98.4% |
| Canadians | 99.7 /100 | #66 | Exceptional 98.4% |
| Immigrants | Northern Europe | 99.6 /100 | #67 | Exceptional 98.4% |
| Russians | 99.6 /100 | #68 | Exceptional 98.4% |
| Immigrants | Austria | 99.6 /100 | #69 | Exceptional 98.4% |
Demographics Similar to Immigrants from Ethiopia by Nursery School
In terms of nursery school, the demographic groups most similar to Immigrants from Ethiopia are Fijian (97.6%, a difference of 0.0%), Armenian (97.6%, a difference of 0.010%), Immigrants from South America (97.6%, a difference of 0.010%), Cuban (97.6%, a difference of 0.010%), and Taiwanese (97.6%, a difference of 0.010%).
| Demographics | Rating | Rank | Nursery School |
| Immigrants | Asia | 0.7 /100 | #255 | Tragic 97.6% |
| Yaqui | 0.6 /100 | #256 | Tragic 97.6% |
| Immigrants | Colombia | 0.6 /100 | #257 | Tragic 97.6% |
| Jamaicans | 0.6 /100 | #258 | Tragic 97.6% |
| Armenians | 0.4 /100 | #259 | Tragic 97.6% |
| Immigrants | South America | 0.4 /100 | #260 | Tragic 97.6% |
| Cubans | 0.4 /100 | #261 | Tragic 97.6% |
| Immigrants | Ethiopia | 0.4 /100 | #262 | Tragic 97.6% |
| Fijians | 0.3 /100 | #263 | Tragic 97.6% |
| Taiwanese | 0.3 /100 | #264 | Tragic 97.6% |
| Assyrians/Chaldeans/Syriacs | 0.3 /100 | #265 | Tragic 97.6% |
| Immigrants | Sierra Leone | 0.3 /100 | #266 | Tragic 97.6% |
| Immigrants | Nigeria | 0.3 /100 | #267 | Tragic 97.5% |
| West Indians | 0.3 /100 | #268 | Tragic 97.5% |
| Immigrants | Liberia | 0.3 /100 | #269 | Tragic 97.5% |