Creek vs Immigrants from Uganda Unemployment
COMPARE
Creek
Immigrants from Uganda
Unemployment
Unemployment Comparison
Creek
Immigrants from Uganda
5.4%
UNEMPLOYMENT
19.4/ 100
METRIC RATING
207th/ 347
METRIC RANK
5.3%
UNEMPLOYMENT
37.8/ 100
METRIC RATING
186th/ 347
METRIC RANK
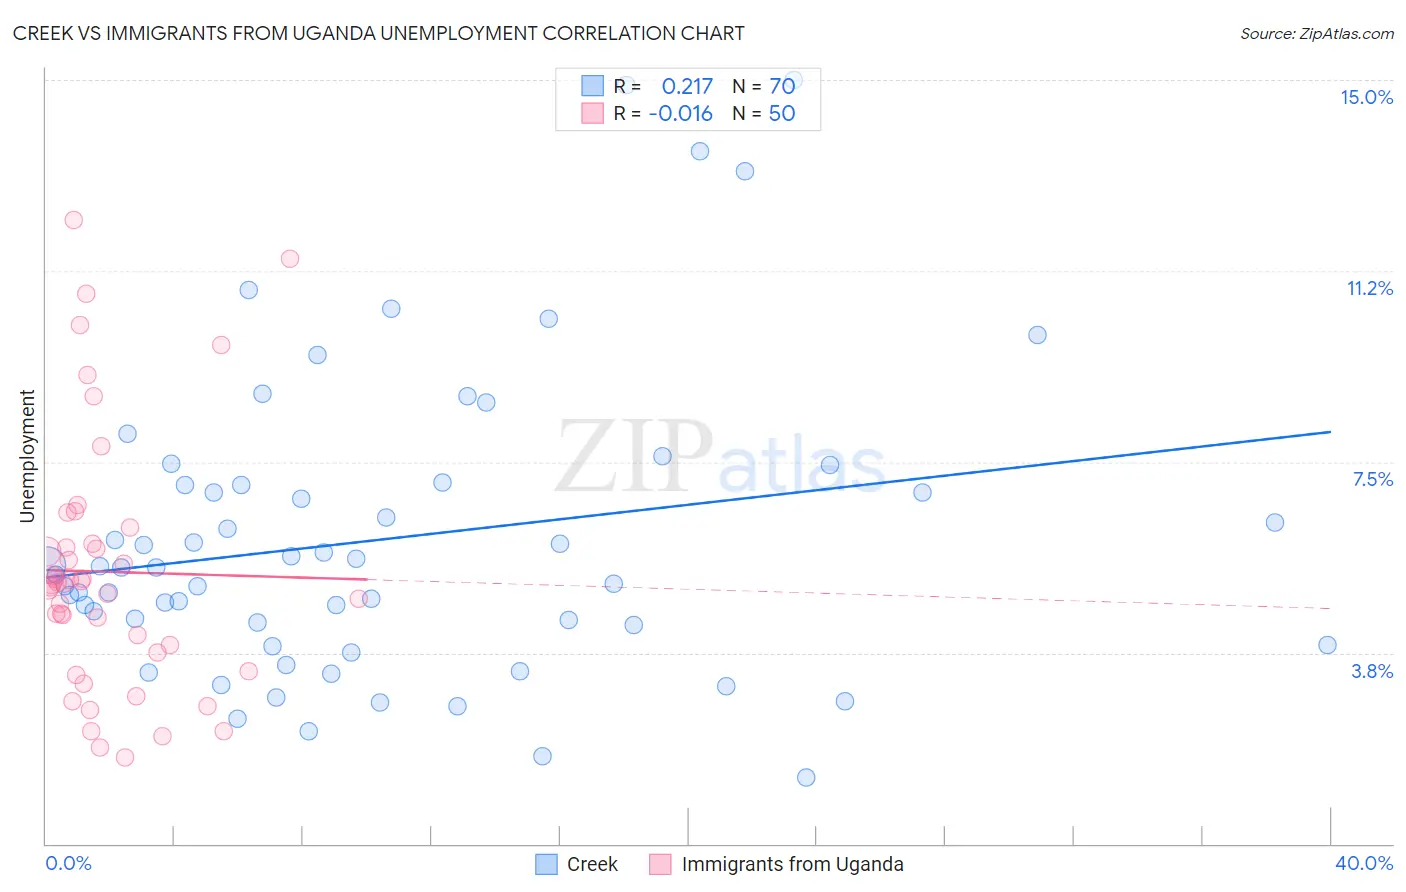
Creek vs Immigrants from Uganda Unemployment Correlation Chart
The statistical analysis conducted on geographies consisting of 178,280,208 people shows a weak positive correlation between the proportion of Creek and unemployment in the United States with a correlation coefficient (R) of 0.217 and weighted average of 5.4%. Similarly, the statistical analysis conducted on geographies consisting of 125,961,312 people shows no correlation between the proportion of Immigrants from Uganda and unemployment in the United States with a correlation coefficient (R) of -0.016 and weighted average of 5.3%, a difference of 1.4%.
Unemployment Correlation Summary
| Measurement | Creek | Immigrants from Uganda |
| Minimum | 1.3% | 1.7% |
| Maximum | 15.0% | 12.2% |
| Range | 13.7% | 10.5% |
| Mean | 6.0% | 5.3% |
| Median | 5.4% | 5.1% |
| Interquartile 25% (IQ1) | 4.3% | 3.7% |
| Interquartile 75% (IQ3) | 7.1% | 5.9% |
| Interquartile Range (IQR) | 2.8% | 2.2% |
| Standard Deviation (Sample) | 2.9% | 2.5% |
| Standard Deviation (Population) | 2.9% | 2.5% |
Similar Demographics by Unemployment
Demographics Similar to Creek by Unemployment
In terms of unemployment, the demographic groups most similar to Creek are Portuguese (5.4%, a difference of 0.030%), Immigrants from Iran (5.4%, a difference of 0.060%), Immigrants from Iraq (5.4%, a difference of 0.080%), Iraqi (5.4%, a difference of 0.13%), and Ugandan (5.4%, a difference of 0.14%).
| Demographics | Rating | Rank | Unemployment |
| Koreans | 27.4 /100 | #200 | Fair 5.3% |
| Immigrants | South Eastern Asia | 27.0 /100 | #201 | Fair 5.3% |
| Cherokee | 25.5 /100 | #202 | Fair 5.3% |
| Immigrants | Micronesia | 25.2 /100 | #203 | Fair 5.3% |
| Immigrants | Ukraine | 24.9 /100 | #204 | Fair 5.3% |
| Native Hawaiians | 24.1 /100 | #205 | Fair 5.3% |
| Immigrants | Peru | 22.7 /100 | #206 | Fair 5.4% |
| Creek | 19.4 /100 | #207 | Poor 5.4% |
| Portuguese | 19.0 /100 | #208 | Poor 5.4% |
| Immigrants | Iran | 18.8 /100 | #209 | Poor 5.4% |
| Immigrants | Iraq | 18.6 /100 | #210 | Poor 5.4% |
| Iraqis | 18.1 /100 | #211 | Poor 5.4% |
| Ugandans | 18.0 /100 | #212 | Poor 5.4% |
| Immigrants | Middle Africa | 15.3 /100 | #213 | Poor 5.4% |
| Immigrants | Costa Rica | 15.2 /100 | #214 | Poor 5.4% |
Demographics Similar to Immigrants from Uganda by Unemployment
In terms of unemployment, the demographic groups most similar to Immigrants from Uganda are Costa Rican (5.3%, a difference of 0.030%), Alsatian (5.3%, a difference of 0.050%), Immigrants from Thailand (5.3%, a difference of 0.070%), Assyrian/Chaldean/Syriac (5.3%, a difference of 0.090%), and Brazilian (5.3%, a difference of 0.15%).
| Demographics | Rating | Rank | Unemployment |
| Malaysians | 46.8 /100 | #179 | Average 5.3% |
| Immigrants | Greece | 45.0 /100 | #180 | Average 5.3% |
| Albanians | 43.5 /100 | #181 | Average 5.3% |
| Spaniards | 42.2 /100 | #182 | Average 5.3% |
| Brazilians | 40.2 /100 | #183 | Average 5.3% |
| Assyrians/Chaldeans/Syriacs | 39.2 /100 | #184 | Fair 5.3% |
| Immigrants | Thailand | 38.9 /100 | #185 | Fair 5.3% |
| Immigrants | Uganda | 37.8 /100 | #186 | Fair 5.3% |
| Costa Ricans | 37.4 /100 | #187 | Fair 5.3% |
| Alsatians | 37.0 /100 | #188 | Fair 5.3% |
| Immigrants | Belarus | 35.6 /100 | #189 | Fair 5.3% |
| Arabs | 35.3 /100 | #190 | Fair 5.3% |
| Somalis | 34.0 /100 | #191 | Fair 5.3% |
| South Americans | 33.9 /100 | #192 | Fair 5.3% |
| Immigrants | Somalia | 33.8 /100 | #193 | Fair 5.3% |