Creek vs Immigrants from Burma/Myanmar Unemployment
COMPARE
Creek
Immigrants from Burma/Myanmar
Unemployment
Unemployment Comparison
Creek
Immigrants from Burma/Myanmar
5.4%
UNEMPLOYMENT
19.4/ 100
METRIC RATING
207th/ 347
METRIC RANK
5.1%
UNEMPLOYMENT
86.2/ 100
METRIC RATING
135th/ 347
METRIC RANK
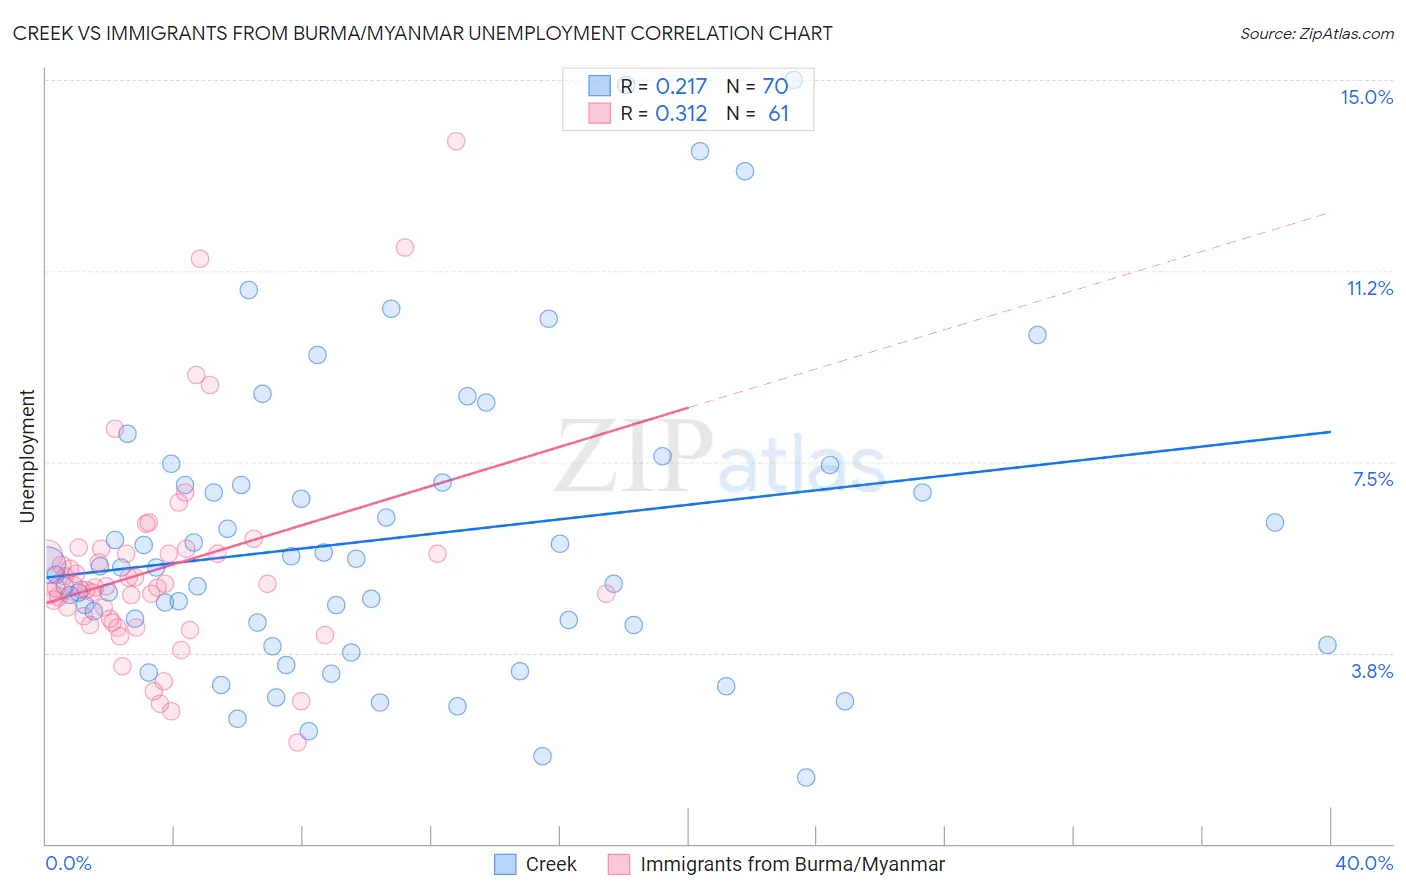
Creek vs Immigrants from Burma/Myanmar Unemployment Correlation Chart
The statistical analysis conducted on geographies consisting of 178,280,208 people shows a weak positive correlation between the proportion of Creek and unemployment in the United States with a correlation coefficient (R) of 0.217 and weighted average of 5.4%. Similarly, the statistical analysis conducted on geographies consisting of 172,291,734 people shows a mild positive correlation between the proportion of Immigrants from Burma/Myanmar and unemployment in the United States with a correlation coefficient (R) of 0.312 and weighted average of 5.1%, a difference of 5.1%.
Unemployment Correlation Summary
| Measurement | Creek | Immigrants from Burma/Myanmar |
| Minimum | 1.3% | 2.0% |
| Maximum | 15.0% | 13.8% |
| Range | 13.7% | 11.8% |
| Mean | 6.0% | 5.4% |
| Median | 5.4% | 5.0% |
| Interquartile 25% (IQ1) | 4.3% | 4.4% |
| Interquartile 75% (IQ3) | 7.1% | 5.7% |
| Interquartile Range (IQR) | 2.8% | 1.3% |
| Standard Deviation (Sample) | 2.9% | 2.1% |
| Standard Deviation (Population) | 2.9% | 2.0% |
Similar Demographics by Unemployment
Demographics Similar to Creek by Unemployment
In terms of unemployment, the demographic groups most similar to Creek are Portuguese (5.4%, a difference of 0.030%), Immigrants from Iran (5.4%, a difference of 0.060%), Immigrants from Iraq (5.4%, a difference of 0.080%), Iraqi (5.4%, a difference of 0.13%), and Ugandan (5.4%, a difference of 0.14%).
| Demographics | Rating | Rank | Unemployment |
| Koreans | 27.4 /100 | #200 | Fair 5.3% |
| Immigrants | South Eastern Asia | 27.0 /100 | #201 | Fair 5.3% |
| Cherokee | 25.5 /100 | #202 | Fair 5.3% |
| Immigrants | Micronesia | 25.2 /100 | #203 | Fair 5.3% |
| Immigrants | Ukraine | 24.9 /100 | #204 | Fair 5.3% |
| Native Hawaiians | 24.1 /100 | #205 | Fair 5.3% |
| Immigrants | Peru | 22.7 /100 | #206 | Fair 5.4% |
| Creek | 19.4 /100 | #207 | Poor 5.4% |
| Portuguese | 19.0 /100 | #208 | Poor 5.4% |
| Immigrants | Iran | 18.8 /100 | #209 | Poor 5.4% |
| Immigrants | Iraq | 18.6 /100 | #210 | Poor 5.4% |
| Iraqis | 18.1 /100 | #211 | Poor 5.4% |
| Ugandans | 18.0 /100 | #212 | Poor 5.4% |
| Immigrants | Middle Africa | 15.3 /100 | #213 | Poor 5.4% |
| Immigrants | Costa Rica | 15.2 /100 | #214 | Poor 5.4% |
Demographics Similar to Immigrants from Burma/Myanmar by Unemployment
In terms of unemployment, the demographic groups most similar to Immigrants from Burma/Myanmar are Immigrants from Europe (5.1%, a difference of 0.010%), Immigrants from Spain (5.1%, a difference of 0.010%), Immigrants from Jordan (5.1%, a difference of 0.050%), Immigrants from Ethiopia (5.1%, a difference of 0.060%), and Immigrants from Croatia (5.1%, a difference of 0.070%).
| Demographics | Rating | Rank | Unemployment |
| Immigrants | Eastern Africa | 88.1 /100 | #128 | Excellent 5.1% |
| Immigrants | Latvia | 88.0 /100 | #129 | Excellent 5.1% |
| Iranians | 86.9 /100 | #130 | Excellent 5.1% |
| Immigrants | Croatia | 86.8 /100 | #131 | Excellent 5.1% |
| Immigrants | Ethiopia | 86.7 /100 | #132 | Excellent 5.1% |
| Immigrants | Jordan | 86.6 /100 | #133 | Excellent 5.1% |
| Immigrants | Europe | 86.3 /100 | #134 | Excellent 5.1% |
| Immigrants | Burma/Myanmar | 86.2 /100 | #135 | Excellent 5.1% |
| Immigrants | Spain | 86.2 /100 | #136 | Excellent 5.1% |
| Immigrants | Saudi Arabia | 85.6 /100 | #137 | Excellent 5.1% |
| Immigrants | Hungary | 85.6 /100 | #138 | Excellent 5.1% |
| Pakistanis | 85.3 /100 | #139 | Excellent 5.1% |
| Immigrants | Denmark | 84.3 /100 | #140 | Excellent 5.1% |
| Palestinians | 83.4 /100 | #141 | Excellent 5.1% |
| Immigrants | Pakistan | 83.2 /100 | #142 | Excellent 5.1% |