Comanche vs Laotian Unemployment
COMPARE
Comanche
Laotian
Unemployment
Unemployment Comparison
Comanche
Laotians
5.5%
UNEMPLOYMENT
4.9/ 100
METRIC RATING
232nd/ 347
METRIC RANK
5.2%
UNEMPLOYMENT
66.3/ 100
METRIC RATING
160th/ 347
METRIC RANK
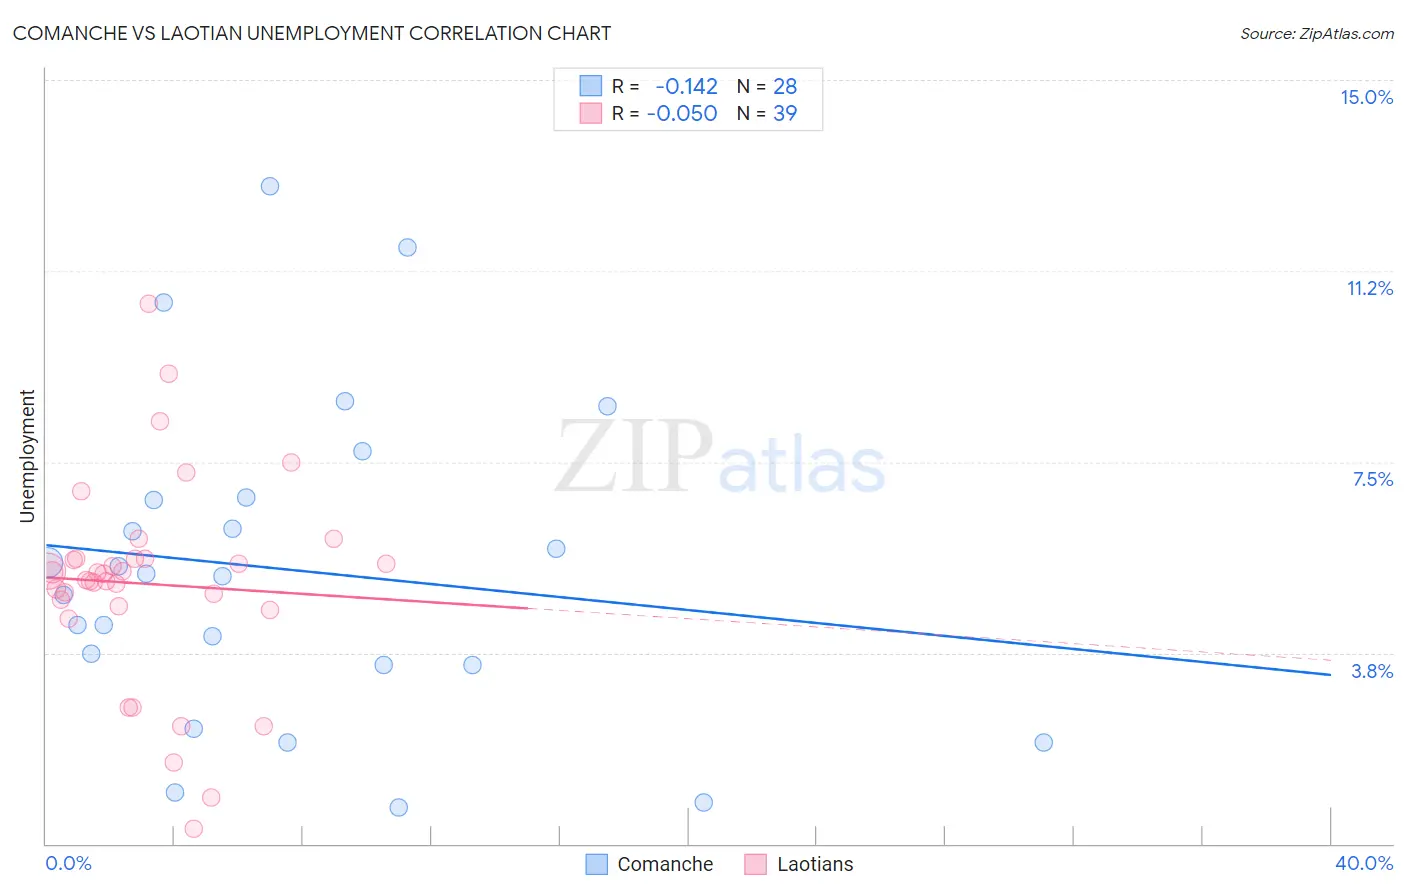
Comanche vs Laotian Unemployment Correlation Chart
The statistical analysis conducted on geographies consisting of 109,712,391 people shows a poor negative correlation between the proportion of Comanche and unemployment in the United States with a correlation coefficient (R) of -0.142 and weighted average of 5.5%. Similarly, the statistical analysis conducted on geographies consisting of 224,771,709 people shows a slight negative correlation between the proportion of Laotians and unemployment in the United States with a correlation coefficient (R) of -0.050 and weighted average of 5.2%, a difference of 5.6%.
Unemployment Correlation Summary
| Measurement | Comanche | Laotian |
| Minimum | 0.70% | 0.30% |
| Maximum | 12.9% | 10.6% |
| Range | 12.2% | 10.3% |
| Mean | 5.4% | 5.1% |
| Median | 5.3% | 5.3% |
| Interquartile 25% (IQ1) | 3.5% | 4.7% |
| Interquartile 75% (IQ3) | 6.8% | 5.6% |
| Interquartile Range (IQR) | 3.3% | 0.94% |
| Standard Deviation (Sample) | 3.1% | 2.0% |
| Standard Deviation (Population) | 3.1% | 2.0% |
Similar Demographics by Unemployment
Demographics Similar to Comanche by Unemployment
In terms of unemployment, the demographic groups most similar to Comanche are Immigrants from Africa (5.5%, a difference of 0.0%), Immigrants from Syria (5.5%, a difference of 0.050%), Panamanian (5.5%, a difference of 0.080%), Hawaiian (5.5%, a difference of 0.13%), and Ottawa (5.5%, a difference of 0.13%).
| Demographics | Rating | Rank | Unemployment |
| South American Indians | 7.8 /100 | #225 | Tragic 5.5% |
| Samoans | 7.1 /100 | #226 | Tragic 5.5% |
| Immigrants | Lebanon | 7.0 /100 | #227 | Tragic 5.5% |
| Guamanians/Chamorros | 6.3 /100 | #228 | Tragic 5.5% |
| Hawaiians | 5.4 /100 | #229 | Tragic 5.5% |
| Ottawa | 5.4 /100 | #230 | Tragic 5.5% |
| Immigrants | Africa | 4.9 /100 | #231 | Tragic 5.5% |
| Comanche | 4.9 /100 | #232 | Tragic 5.5% |
| Immigrants | Syria | 4.8 /100 | #233 | Tragic 5.5% |
| Panamanians | 4.7 /100 | #234 | Tragic 5.5% |
| Immigrants | Panama | 3.4 /100 | #235 | Tragic 5.5% |
| Immigrants | Cambodia | 3.3 /100 | #236 | Tragic 5.5% |
| Moroccans | 3.2 /100 | #237 | Tragic 5.5% |
| Immigrants | Western Asia | 2.8 /100 | #238 | Tragic 5.5% |
| Immigrants | Immigrants | 2.6 /100 | #239 | Tragic 5.5% |
Demographics Similar to Laotians by Unemployment
In terms of unemployment, the demographic groups most similar to Laotians are Immigrants from Egypt (5.2%, a difference of 0.020%), Immigrants from Russia (5.2%, a difference of 0.020%), Immigrants from Oceania (5.2%, a difference of 0.080%), Spanish (5.2%, a difference of 0.090%), and Immigrants from Zaire (5.2%, a difference of 0.11%).
| Demographics | Rating | Rank | Unemployment |
| Egyptians | 75.2 /100 | #153 | Good 5.2% |
| Immigrants | China | 74.7 /100 | #154 | Good 5.2% |
| Immigrants | Northern Africa | 71.3 /100 | #155 | Good 5.2% |
| Immigrants | Kazakhstan | 70.4 /100 | #156 | Good 5.2% |
| Sri Lankans | 69.5 /100 | #157 | Good 5.2% |
| Immigrants | Egypt | 66.7 /100 | #158 | Good 5.2% |
| Immigrants | Russia | 66.6 /100 | #159 | Good 5.2% |
| Laotians | 66.3 /100 | #160 | Good 5.2% |
| Immigrants | Oceania | 65.2 /100 | #161 | Good 5.2% |
| Spanish | 65.1 /100 | #162 | Good 5.2% |
| Immigrants | Zaire | 64.7 /100 | #163 | Good 5.2% |
| Immigrants | Colombia | 64.7 /100 | #164 | Good 5.2% |
| Immigrants | Brazil | 63.1 /100 | #165 | Good 5.2% |
| Immigrants | Indonesia | 61.2 /100 | #166 | Good 5.2% |
| Colombians | 61.1 /100 | #167 | Good 5.2% |