Comanche vs Slavic Disability Age Over 75
COMPARE
Comanche
Slavic
Disability Age Over 75
Disability Age Over 75 Comparison
Comanche
Slavs
51.7%
DISABILITY AGE OVER 75
0.0/ 100
METRIC RATING
322nd/ 347
METRIC RANK
46.1%
DISABILITY AGE OVER 75
98.9/ 100
METRIC RATING
76th/ 347
METRIC RANK
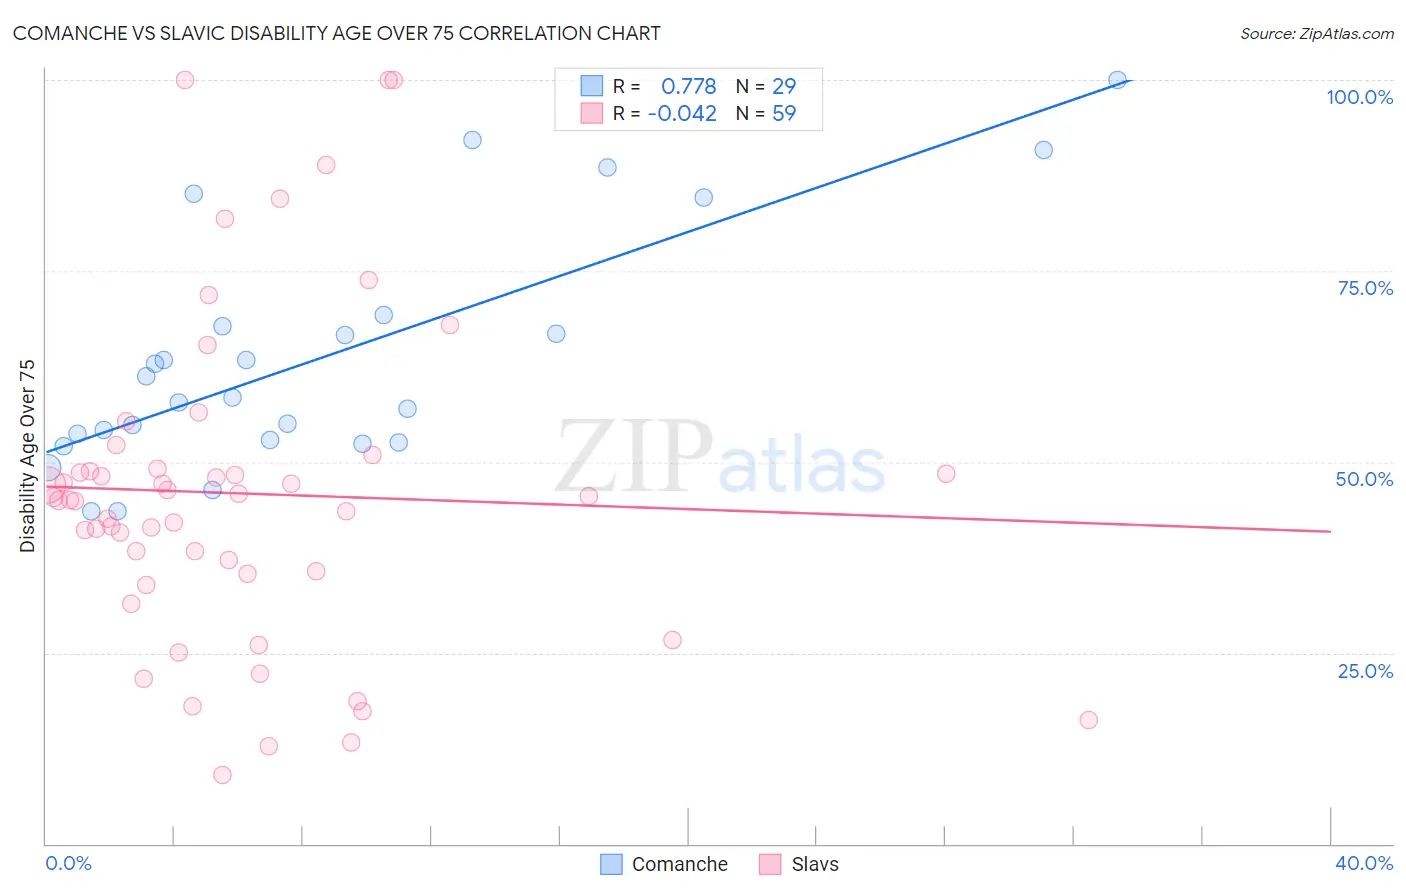
Comanche vs Slavic Disability Age Over 75 Correlation Chart
The statistical analysis conducted on geographies consisting of 109,684,350 people shows a strong positive correlation between the proportion of Comanche and percentage of population with a disability over the age of 75 in the United States with a correlation coefficient (R) of 0.778 and weighted average of 51.7%. Similarly, the statistical analysis conducted on geographies consisting of 270,699,743 people shows no correlation between the proportion of Slavs and percentage of population with a disability over the age of 75 in the United States with a correlation coefficient (R) of -0.042 and weighted average of 46.1%, a difference of 12.1%.
Disability Age Over 75 Correlation Summary
| Measurement | Comanche | Slavic |
| Minimum | 43.6% | 9.0% |
| Maximum | 100.0% | 100.0% |
| Range | 56.4% | 91.0% |
| Mean | 63.7% | 45.9% |
| Median | 58.4% | 45.1% |
| Interquartile 25% (IQ1) | 52.7% | 35.3% |
| Interquartile 75% (IQ3) | 68.5% | 49.1% |
| Interquartile Range (IQR) | 15.8% | 13.8% |
| Standard Deviation (Sample) | 15.5% | 21.2% |
| Standard Deviation (Population) | 15.2% | 21.0% |
Similar Demographics by Disability Age Over 75
Demographics Similar to Comanche by Disability Age Over 75
In terms of disability age over 75, the demographic groups most similar to Comanche are Paiute (51.5%, a difference of 0.34%), Dutch West Indian (51.5%, a difference of 0.34%), Creek (51.5%, a difference of 0.48%), Seminole (51.5%, a difference of 0.49%), and Immigrants from Yemen (52.0%, a difference of 0.52%).
| Demographics | Rating | Rank | Disability Age Over 75 |
| Mexicans | 0.0 /100 | #315 | Tragic 51.1% |
| Chickasaw | 0.0 /100 | #316 | Tragic 51.2% |
| Yakama | 0.0 /100 | #317 | Tragic 51.3% |
| Seminole | 0.0 /100 | #318 | Tragic 51.5% |
| Creek | 0.0 /100 | #319 | Tragic 51.5% |
| Paiute | 0.0 /100 | #320 | Tragic 51.5% |
| Dutch West Indians | 0.0 /100 | #321 | Tragic 51.5% |
| Comanche | 0.0 /100 | #322 | Tragic 51.7% |
| Immigrants | Yemen | 0.0 /100 | #323 | Tragic 52.0% |
| Menominee | 0.0 /100 | #324 | Tragic 52.3% |
| Immigrants | Cabo Verde | 0.0 /100 | #325 | Tragic 52.4% |
| Ute | 0.0 /100 | #326 | Tragic 52.6% |
| Nepalese | 0.0 /100 | #327 | Tragic 52.6% |
| Choctaw | 0.0 /100 | #328 | Tragic 52.7% |
| Alaska Natives | 0.0 /100 | #329 | Tragic 52.8% |
Demographics Similar to Slavs by Disability Age Over 75
In terms of disability age over 75, the demographic groups most similar to Slavs are Serbian (46.1%, a difference of 0.010%), Immigrants from Eastern Asia (46.2%, a difference of 0.040%), Egyptian (46.1%, a difference of 0.050%), Immigrants from Western Europe (46.2%, a difference of 0.050%), and Cambodian (46.1%, a difference of 0.090%).
| Demographics | Rating | Rank | Disability Age Over 75 |
| Immigrants | Romania | 99.3 /100 | #69 | Exceptional 46.0% |
| Jordanians | 99.2 /100 | #70 | Exceptional 46.1% |
| Immigrants | Sri Lanka | 99.2 /100 | #71 | Exceptional 46.1% |
| Immigrants | Hungary | 99.1 /100 | #72 | Exceptional 46.1% |
| Cambodians | 99.1 /100 | #73 | Exceptional 46.1% |
| Egyptians | 99.0 /100 | #74 | Exceptional 46.1% |
| Serbians | 99.0 /100 | #75 | Exceptional 46.1% |
| Slavs | 98.9 /100 | #76 | Exceptional 46.1% |
| Immigrants | Eastern Asia | 98.9 /100 | #77 | Exceptional 46.2% |
| Immigrants | Western Europe | 98.8 /100 | #78 | Exceptional 46.2% |
| Swiss | 98.8 /100 | #79 | Exceptional 46.2% |
| Soviet Union | 98.8 /100 | #80 | Exceptional 46.2% |
| New Zealanders | 98.8 /100 | #81 | Exceptional 46.2% |
| Immigrants | Latvia | 98.7 /100 | #82 | Exceptional 46.2% |
| Argentineans | 98.7 /100 | #83 | Exceptional 46.2% |