Comanche vs Slavic Professional Degree
COMPARE
Comanche
Slavic
Professional Degree
Professional Degree Comparison
Comanche
Slavs
3.5%
PROFESSIONAL DEGREE
0.4/ 100
METRIC RATING
283rd/ 347
METRIC RANK
4.5%
PROFESSIONAL DEGREE
70.8/ 100
METRIC RATING
155th/ 347
METRIC RANK
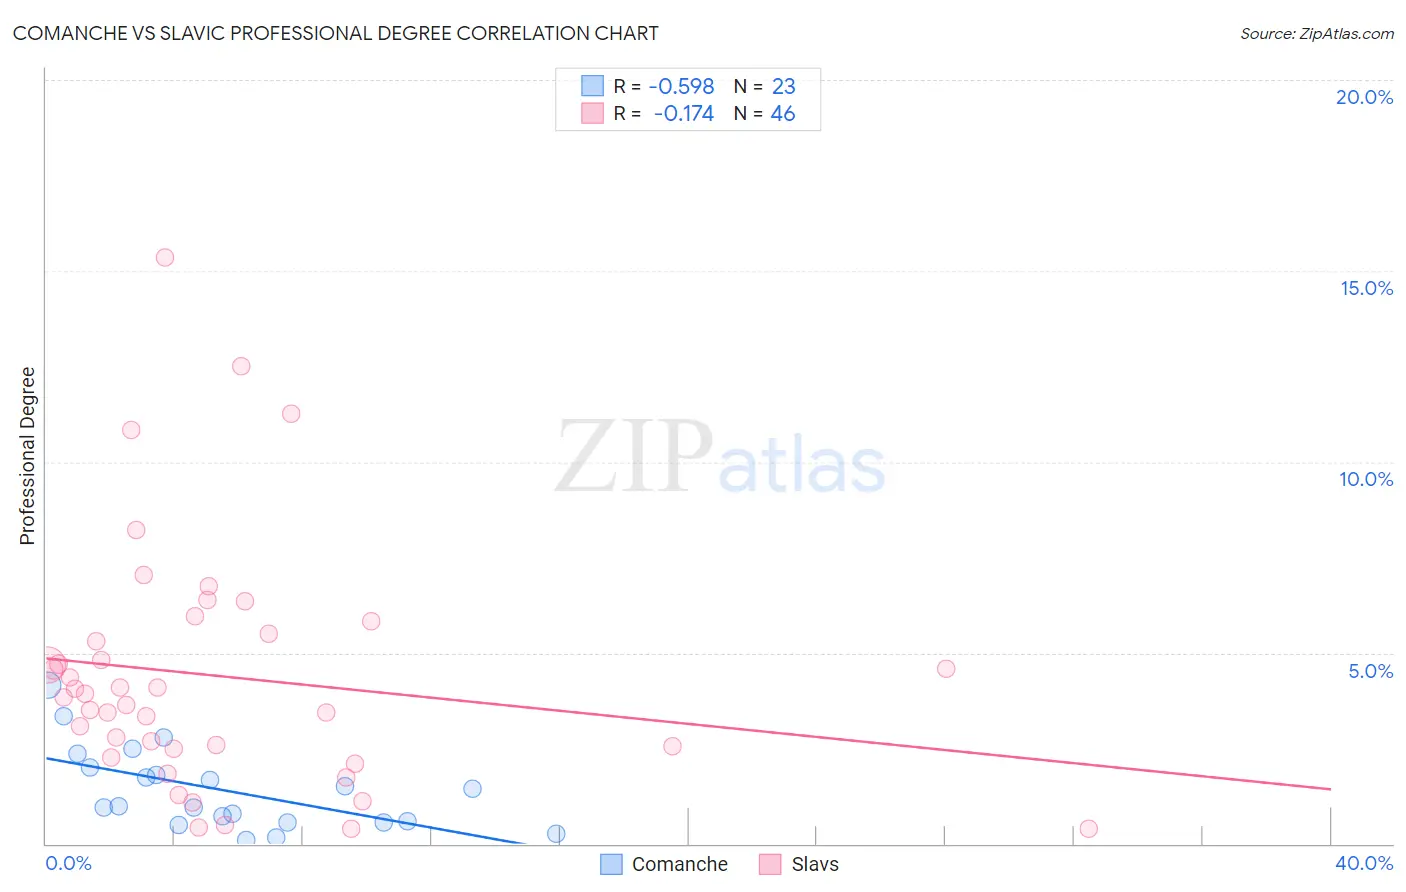
Comanche vs Slavic Professional Degree Correlation Chart
The statistical analysis conducted on geographies consisting of 109,559,847 people shows a substantial negative correlation between the proportion of Comanche and percentage of population with at least professional degree education in the United States with a correlation coefficient (R) of -0.598 and weighted average of 3.5%. Similarly, the statistical analysis conducted on geographies consisting of 270,501,268 people shows a poor negative correlation between the proportion of Slavs and percentage of population with at least professional degree education in the United States with a correlation coefficient (R) of -0.174 and weighted average of 4.5%, a difference of 28.7%.
Professional Degree Correlation Summary
| Measurement | Comanche | Slavic |
| Minimum | 0.11% | 0.39% |
| Maximum | 4.1% | 15.4% |
| Range | 4.0% | 15.0% |
| Mean | 1.4% | 4.4% |
| Median | 0.97% | 3.9% |
| Interquartile 25% (IQ1) | 0.57% | 2.5% |
| Interquartile 75% (IQ3) | 2.0% | 5.5% |
| Interquartile Range (IQR) | 1.4% | 3.0% |
| Standard Deviation (Sample) | 1.1% | 3.2% |
| Standard Deviation (Population) | 1.0% | 3.2% |
Similar Demographics by Professional Degree
Demographics Similar to Comanche by Professional Degree
In terms of professional degree, the demographic groups most similar to Comanche are Salvadoran (3.5%, a difference of 0.10%), Immigrants from Caribbean (3.5%, a difference of 0.30%), Apache (3.5%, a difference of 0.32%), Dominican (3.5%, a difference of 0.34%), and Immigrants from Portugal (3.5%, a difference of 0.38%).
| Demographics | Rating | Rank | Professional Degree |
| Liberians | 0.5 /100 | #276 | Tragic 3.6% |
| Cheyenne | 0.5 /100 | #277 | Tragic 3.6% |
| Japanese | 0.5 /100 | #278 | Tragic 3.5% |
| Immigrants | Portugal | 0.5 /100 | #279 | Tragic 3.5% |
| Dominicans | 0.5 /100 | #280 | Tragic 3.5% |
| Apache | 0.5 /100 | #281 | Tragic 3.5% |
| Immigrants | Caribbean | 0.5 /100 | #282 | Tragic 3.5% |
| Comanche | 0.4 /100 | #283 | Tragic 3.5% |
| Salvadorans | 0.4 /100 | #284 | Tragic 3.5% |
| Hondurans | 0.3 /100 | #285 | Tragic 3.5% |
| Haitians | 0.3 /100 | #286 | Tragic 3.5% |
| Immigrants | El Salvador | 0.3 /100 | #287 | Tragic 3.5% |
| Blackfeet | 0.3 /100 | #288 | Tragic 3.5% |
| Guatemalans | 0.3 /100 | #289 | Tragic 3.5% |
| Chippewa | 0.3 /100 | #290 | Tragic 3.5% |
Demographics Similar to Slavs by Professional Degree
In terms of professional degree, the demographic groups most similar to Slavs are Swedish (4.5%, a difference of 0.15%), Iraqi (4.5%, a difference of 0.16%), Scottish (4.6%, a difference of 0.18%), Immigrants from Africa (4.6%, a difference of 0.30%), and Immigrants from Uruguay (4.6%, a difference of 0.30%).
| Demographics | Rating | Rank | Professional Degree |
| Slovenes | 76.1 /100 | #148 | Good 4.6% |
| Senegalese | 75.3 /100 | #149 | Good 4.6% |
| Immigrants | Oceania | 73.4 /100 | #150 | Good 4.6% |
| Poles | 72.6 /100 | #151 | Good 4.6% |
| Immigrants | Africa | 72.5 /100 | #152 | Good 4.6% |
| Immigrants | Uruguay | 72.5 /100 | #153 | Good 4.6% |
| Scottish | 71.8 /100 | #154 | Good 4.6% |
| Slavs | 70.8 /100 | #155 | Good 4.5% |
| Swedes | 69.9 /100 | #156 | Good 4.5% |
| Iraqis | 69.8 /100 | #157 | Good 4.5% |
| Immigrants | Armenia | 68.8 /100 | #158 | Good 4.5% |
| Vietnamese | 68.4 /100 | #159 | Good 4.5% |
| Immigrants | Senegal | 68.0 /100 | #160 | Good 4.5% |
| Assyrians/Chaldeans/Syriacs | 67.4 /100 | #161 | Good 4.5% |
| Peruvians | 65.2 /100 | #162 | Good 4.5% |