Comanche vs Immigrants from Latvia Female Unemployment
COMPARE
Comanche
Immigrants from Latvia
Female Unemployment
Female Unemployment Comparison
Comanche
Immigrants from Latvia
5.4%
FEMALE UNEMPLOYMENT
10.0/ 100
METRIC RATING
216th/ 347
METRIC RANK
5.1%
FEMALE UNEMPLOYMENT
84.6/ 100
METRIC RATING
135th/ 347
METRIC RANK
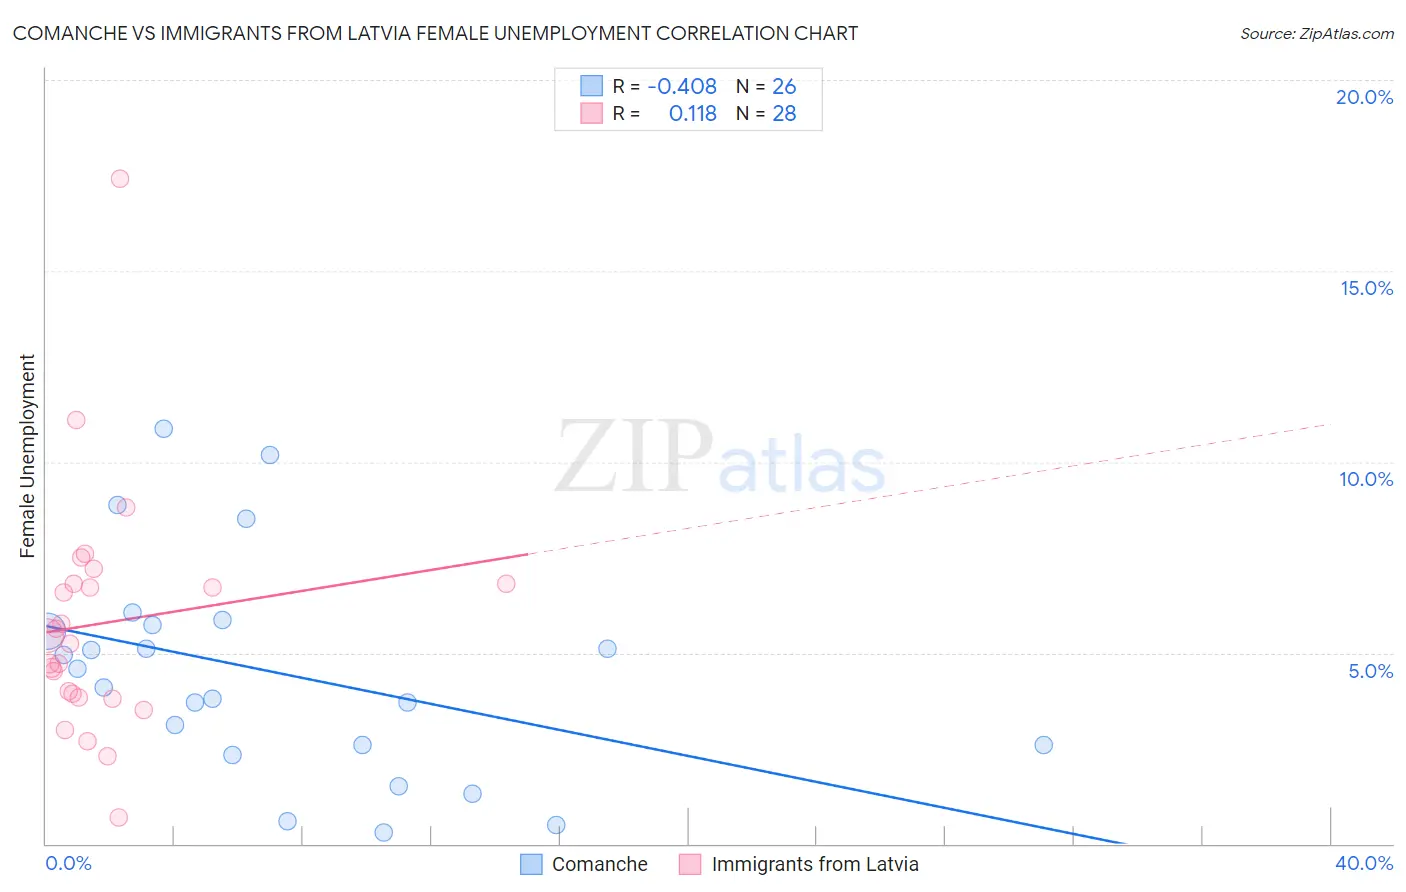
Comanche vs Immigrants from Latvia Female Unemployment Correlation Chart
The statistical analysis conducted on geographies consisting of 109,454,085 people shows a moderate negative correlation between the proportion of Comanche and unemploymnet rate among females in the United States with a correlation coefficient (R) of -0.408 and weighted average of 5.4%. Similarly, the statistical analysis conducted on geographies consisting of 113,613,116 people shows a poor positive correlation between the proportion of Immigrants from Latvia and unemploymnet rate among females in the United States with a correlation coefficient (R) of 0.118 and weighted average of 5.1%, a difference of 6.0%.
Female Unemployment Correlation Summary
| Measurement | Comanche | Immigrants from Latvia |
| Minimum | 0.30% | 0.70% |
| Maximum | 10.9% | 17.4% |
| Range | 10.6% | 16.7% |
| Mean | 4.5% | 5.8% |
| Median | 4.3% | 5.3% |
| Interquartile 25% (IQ1) | 2.6% | 3.9% |
| Interquartile 75% (IQ3) | 5.7% | 6.8% |
| Interquartile Range (IQR) | 3.1% | 2.9% |
| Standard Deviation (Sample) | 2.8% | 3.1% |
| Standard Deviation (Population) | 2.8% | 3.1% |
Similar Demographics by Female Unemployment
Demographics Similar to Comanche by Female Unemployment
In terms of female unemployment, the demographic groups most similar to Comanche are Immigrants from Nicaragua (5.4%, a difference of 0.020%), Seminole (5.4%, a difference of 0.040%), Peruvian (5.4%, a difference of 0.070%), Samoan (5.4%, a difference of 0.090%), and Bermudan (5.4%, a difference of 0.17%).
| Demographics | Rating | Rank | Female Unemployment |
| Koreans | 13.4 /100 | #209 | Poor 5.4% |
| Choctaw | 12.3 /100 | #210 | Poor 5.4% |
| Ottawa | 11.6 /100 | #211 | Poor 5.4% |
| Uruguayans | 11.4 /100 | #212 | Poor 5.4% |
| Samoans | 10.6 /100 | #213 | Poor 5.4% |
| Seminole | 10.3 /100 | #214 | Poor 5.4% |
| Immigrants | Nicaragua | 10.2 /100 | #215 | Poor 5.4% |
| Comanche | 10.0 /100 | #216 | Poor 5.4% |
| Peruvians | 9.6 /100 | #217 | Tragic 5.4% |
| Bermudans | 9.0 /100 | #218 | Tragic 5.4% |
| South Americans | 8.6 /100 | #219 | Tragic 5.4% |
| Immigrants | Africa | 8.5 /100 | #220 | Tragic 5.4% |
| Brazilians | 7.3 /100 | #221 | Tragic 5.5% |
| Nicaraguans | 7.2 /100 | #222 | Tragic 5.5% |
| Delaware | 7.2 /100 | #223 | Tragic 5.5% |
Demographics Similar to Immigrants from Latvia by Female Unemployment
In terms of female unemployment, the demographic groups most similar to Immigrants from Latvia are Immigrants from Eritrea (5.1%, a difference of 0.0%), Immigrants from Hong Kong (5.1%, a difference of 0.030%), Immigrants from Sri Lanka (5.1%, a difference of 0.050%), Indian (Asian) (5.1%, a difference of 0.050%), and Pakistani (5.1%, a difference of 0.090%).
| Demographics | Rating | Rank | Female Unemployment |
| Chileans | 85.8 /100 | #128 | Excellent 5.1% |
| Ethiopians | 85.7 /100 | #129 | Excellent 5.1% |
| Maltese | 85.5 /100 | #130 | Excellent 5.1% |
| Immigrants | Ethiopia | 85.4 /100 | #131 | Excellent 5.1% |
| Immigrants | Sri Lanka | 85.0 /100 | #132 | Excellent 5.1% |
| Immigrants | Hong Kong | 84.8 /100 | #133 | Excellent 5.1% |
| Immigrants | Eritrea | 84.6 /100 | #134 | Excellent 5.1% |
| Immigrants | Latvia | 84.6 /100 | #135 | Excellent 5.1% |
| Indians (Asian) | 84.2 /100 | #136 | Excellent 5.1% |
| Pakistanis | 83.8 /100 | #137 | Excellent 5.1% |
| Chickasaw | 83.2 /100 | #138 | Excellent 5.1% |
| Immigrants | Eastern Asia | 83.0 /100 | #139 | Excellent 5.1% |
| Immigrants | France | 82.7 /100 | #140 | Excellent 5.1% |
| Immigrants | Eastern Europe | 81.5 /100 | #141 | Excellent 5.1% |
| Palestinians | 80.8 /100 | #142 | Excellent 5.1% |