South American Indian vs Arapaho Female Unemployment
COMPARE
South American Indian
Arapaho
Female Unemployment
Female Unemployment Comparison
South American Indians
Arapaho
5.5%
FEMALE UNEMPLOYMENT
2.8/ 100
METRIC RATING
241st/ 347
METRIC RANK
8.8%
FEMALE UNEMPLOYMENT
0.0/ 100
METRIC RATING
343rd/ 347
METRIC RANK
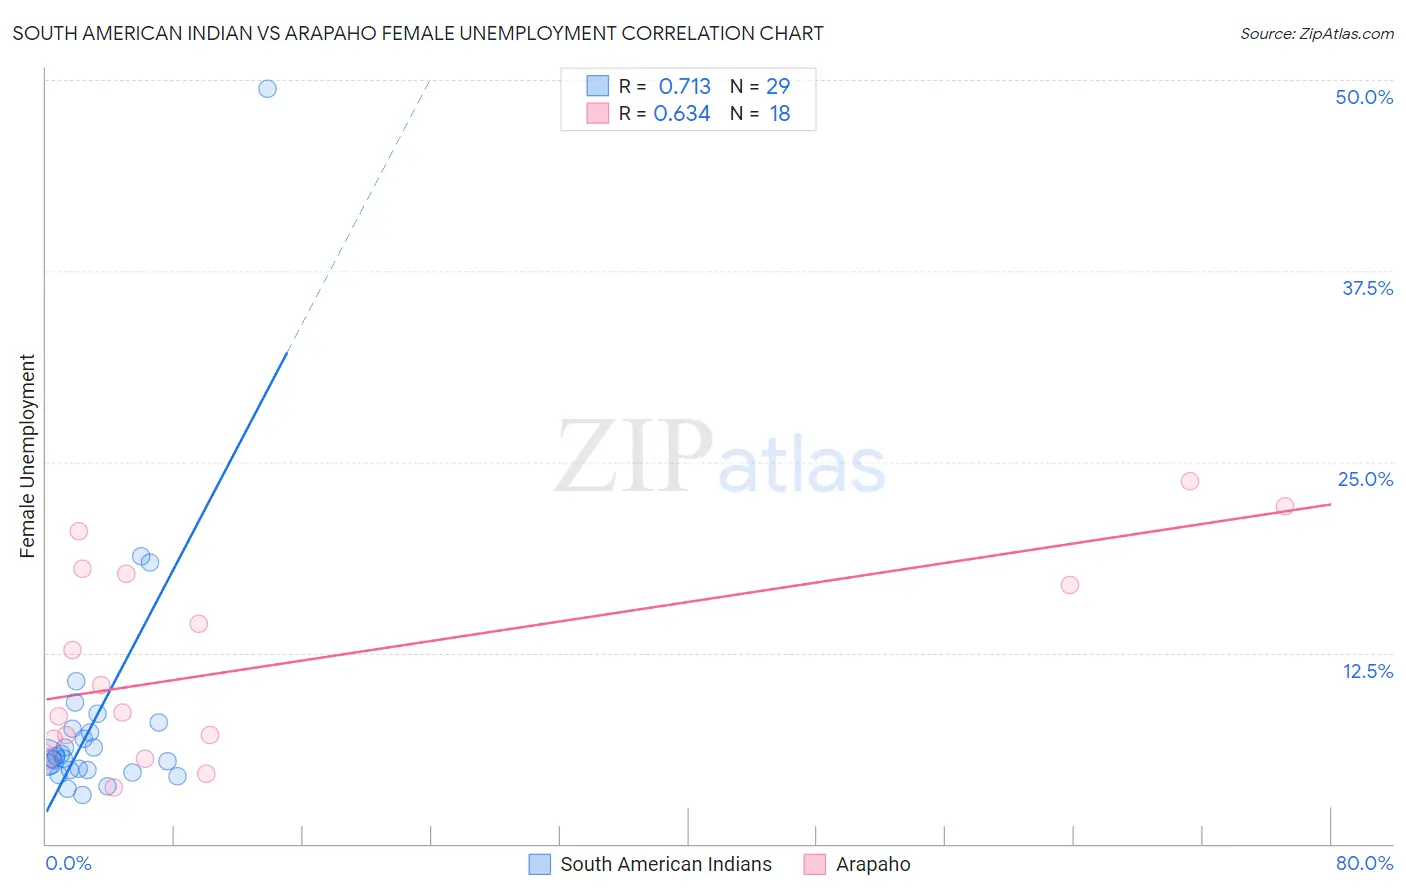
South American Indian vs Arapaho Female Unemployment Correlation Chart
The statistical analysis conducted on geographies consisting of 164,368,347 people shows a strong positive correlation between the proportion of South American Indians and unemploymnet rate among females in the United States with a correlation coefficient (R) of 0.713 and weighted average of 5.5%. Similarly, the statistical analysis conducted on geographies consisting of 29,729,190 people shows a significant positive correlation between the proportion of Arapaho and unemploymnet rate among females in the United States with a correlation coefficient (R) of 0.634 and weighted average of 8.8%, a difference of 58.7%.
Female Unemployment Correlation Summary
| Measurement | South American Indian | Arapaho |
| Minimum | 3.2% | 3.7% |
| Maximum | 49.4% | 23.7% |
| Range | 46.2% | 20.0% |
| Mean | 8.3% | 11.9% |
| Median | 5.6% | 9.5% |
| Interquartile 25% (IQ1) | 4.8% | 6.9% |
| Interquartile 75% (IQ3) | 7.7% | 17.7% |
| Interquartile Range (IQR) | 2.9% | 10.9% |
| Standard Deviation (Sample) | 8.7% | 6.5% |
| Standard Deviation (Population) | 8.6% | 6.3% |
Similar Demographics by Female Unemployment
Demographics Similar to South American Indians by Female Unemployment
In terms of female unemployment, the demographic groups most similar to South American Indians are Immigrants from South America (5.5%, a difference of 0.050%), Aleut (5.5%, a difference of 0.080%), Sierra Leonean (5.5%, a difference of 0.18%), Immigrants from Panama (5.5%, a difference of 0.20%), and Immigrants from Cambodia (5.5%, a difference of 0.23%).
| Demographics | Rating | Rank | Female Unemployment |
| Immigrants | Lebanon | 3.3 /100 | #234 | Tragic 5.5% |
| Immigrants | Iran | 3.3 /100 | #235 | Tragic 5.5% |
| Immigrants | Cambodia | 3.3 /100 | #236 | Tragic 5.5% |
| Immigrants | Panama | 3.2 /100 | #237 | Tragic 5.5% |
| Sierra Leoneans | 3.2 /100 | #238 | Tragic 5.5% |
| Aleuts | 3.0 /100 | #239 | Tragic 5.5% |
| Immigrants | South America | 2.9 /100 | #240 | Tragic 5.5% |
| South American Indians | 2.8 /100 | #241 | Tragic 5.5% |
| Marshallese | 2.3 /100 | #242 | Tragic 5.6% |
| Spanish Americans | 2.2 /100 | #243 | Tragic 5.6% |
| Immigrants | Liberia | 1.5 /100 | #244 | Tragic 5.6% |
| Guamanians/Chamorros | 1.4 /100 | #245 | Tragic 5.6% |
| Japanese | 1.2 /100 | #246 | Tragic 5.6% |
| Immigrants | Western Asia | 1.1 /100 | #247 | Tragic 5.6% |
| Cree | 1.0 /100 | #248 | Tragic 5.6% |
Demographics Similar to Arapaho by Female Unemployment
In terms of female unemployment, the demographic groups most similar to Arapaho are Puerto Rican (8.3%, a difference of 5.4%), Pima (9.3%, a difference of 6.2%), Inupiat (8.2%, a difference of 7.7%), Hopi (8.1%, a difference of 8.6%), and Yuman (9.6%, a difference of 9.1%).
| Demographics | Rating | Rank | Female Unemployment |
| Menominee | 0.0 /100 | #333 | Tragic 7.0% |
| Immigrants | Armenia | 0.0 /100 | #334 | Tragic 7.1% |
| Dominicans | 0.0 /100 | #335 | Tragic 7.2% |
| Immigrants | Dominican Republic | 0.0 /100 | #336 | Tragic 7.2% |
| Navajo | 0.0 /100 | #337 | Tragic 7.3% |
| Tohono O'odham | 0.0 /100 | #338 | Tragic 7.7% |
| Immigrants | Yemen | 0.0 /100 | #339 | Tragic 7.8% |
| Hopi | 0.0 /100 | #340 | Tragic 8.1% |
| Inupiat | 0.0 /100 | #341 | Tragic 8.2% |
| Puerto Ricans | 0.0 /100 | #342 | Tragic 8.3% |
| Arapaho | 0.0 /100 | #343 | Tragic 8.8% |
| Pima | 0.0 /100 | #344 | Tragic 9.3% |
| Yuman | 0.0 /100 | #345 | Tragic 9.6% |
| Yup'ik | 0.0 /100 | #346 | Tragic 10.9% |
| Crow | 0.0 /100 | #347 | Tragic 12.1% |