Immigrants from Sierra Leone vs Arapaho Female Unemployment
COMPARE
Immigrants from Sierra Leone
Arapaho
Female Unemployment
Female Unemployment Comparison
Immigrants from Sierra Leone
Arapaho
5.7%
FEMALE UNEMPLOYMENT
0.6/ 100
METRIC RATING
253rd/ 347
METRIC RANK
8.8%
FEMALE UNEMPLOYMENT
0.0/ 100
METRIC RATING
343rd/ 347
METRIC RANK
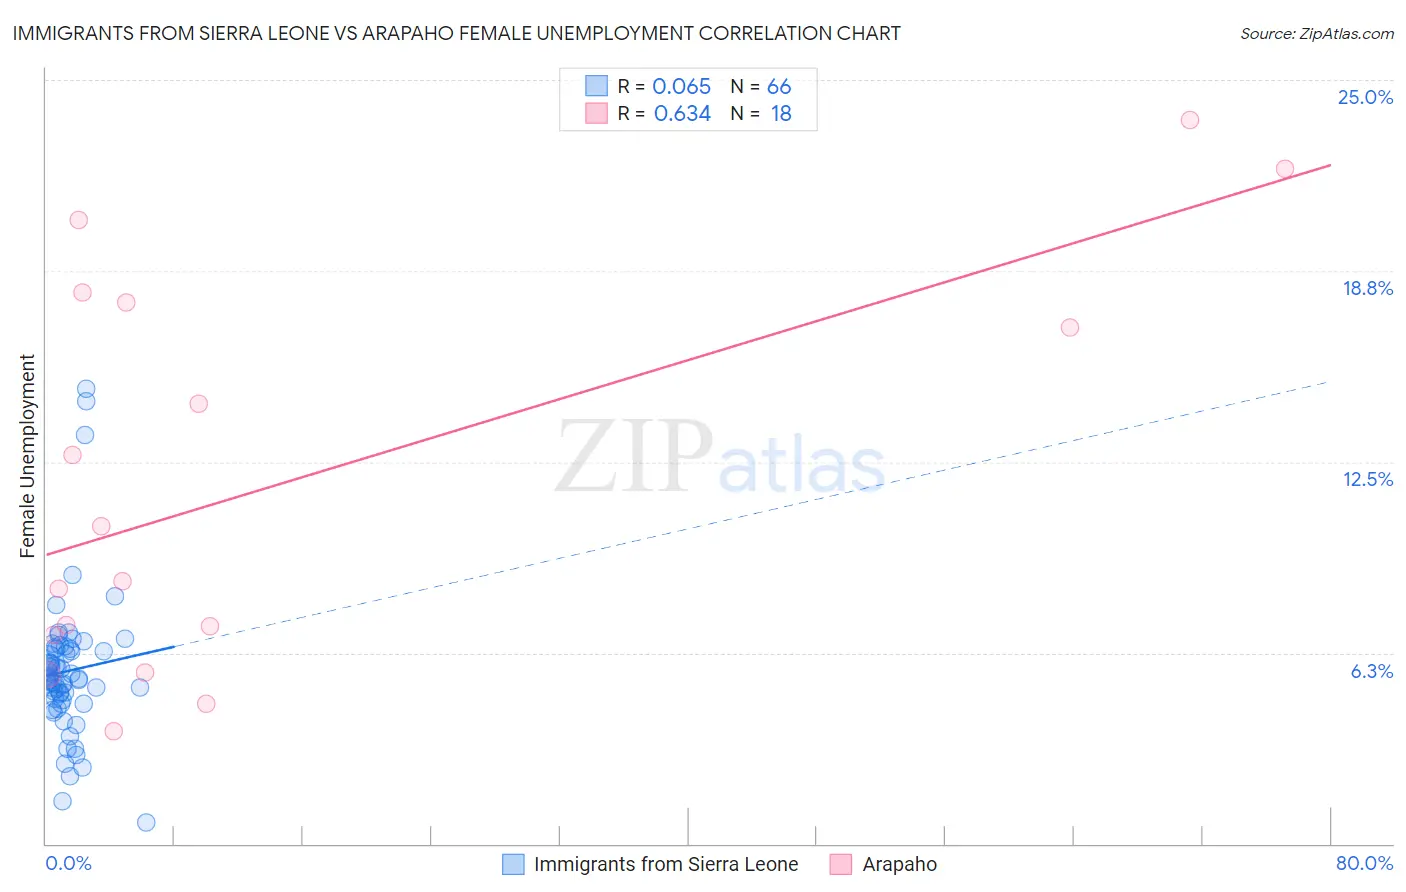
Immigrants from Sierra Leone vs Arapaho Female Unemployment Correlation Chart
The statistical analysis conducted on geographies consisting of 101,591,663 people shows a slight positive correlation between the proportion of Immigrants from Sierra Leone and unemploymnet rate among females in the United States with a correlation coefficient (R) of 0.065 and weighted average of 5.7%. Similarly, the statistical analysis conducted on geographies consisting of 29,729,190 people shows a significant positive correlation between the proportion of Arapaho and unemploymnet rate among females in the United States with a correlation coefficient (R) of 0.634 and weighted average of 8.8%, a difference of 55.2%.
Female Unemployment Correlation Summary
| Measurement | Immigrants from Sierra Leone | Arapaho |
| Minimum | 0.70% | 3.7% |
| Maximum | 14.9% | 23.7% |
| Range | 14.2% | 20.0% |
| Mean | 5.7% | 11.9% |
| Median | 5.4% | 9.5% |
| Interquartile 25% (IQ1) | 4.7% | 6.9% |
| Interquartile 75% (IQ3) | 6.4% | 17.7% |
| Interquartile Range (IQR) | 1.7% | 10.9% |
| Standard Deviation (Sample) | 2.4% | 6.5% |
| Standard Deviation (Population) | 2.4% | 6.3% |
Similar Demographics by Female Unemployment
Demographics Similar to Immigrants from Sierra Leone by Female Unemployment
In terms of female unemployment, the demographic groups most similar to Immigrants from Sierra Leone are Immigrants (5.7%, a difference of 0.0%), Immigrants from Cameroon (5.7%, a difference of 0.040%), Cajun (5.7%, a difference of 0.15%), Assyrian/Chaldean/Syriac (5.6%, a difference of 0.34%), and Immigrants from Syria (5.6%, a difference of 0.41%).
| Demographics | Rating | Rank | Female Unemployment |
| Japanese | 1.2 /100 | #246 | Tragic 5.6% |
| Immigrants | Western Asia | 1.1 /100 | #247 | Tragic 5.6% |
| Cree | 1.0 /100 | #248 | Tragic 5.6% |
| Immigrants | Uzbekistan | 1.0 /100 | #249 | Tragic 5.6% |
| Immigrants | Syria | 0.8 /100 | #250 | Tragic 5.6% |
| Assyrians/Chaldeans/Syriacs | 0.8 /100 | #251 | Tragic 5.6% |
| Cajuns | 0.7 /100 | #252 | Tragic 5.7% |
| Immigrants | Sierra Leone | 0.6 /100 | #253 | Tragic 5.7% |
| Immigrants | Immigrants | 0.6 /100 | #254 | Tragic 5.7% |
| Immigrants | Cameroon | 0.6 /100 | #255 | Tragic 5.7% |
| Sub-Saharan Africans | 0.4 /100 | #256 | Tragic 5.7% |
| Dutch West Indians | 0.3 /100 | #257 | Tragic 5.7% |
| Immigrants | Portugal | 0.2 /100 | #258 | Tragic 5.8% |
| Immigrants | Fiji | 0.2 /100 | #259 | Tragic 5.8% |
| Nigerians | 0.2 /100 | #260 | Tragic 5.8% |
Demographics Similar to Arapaho by Female Unemployment
In terms of female unemployment, the demographic groups most similar to Arapaho are Puerto Rican (8.3%, a difference of 5.4%), Pima (9.3%, a difference of 6.2%), Inupiat (8.2%, a difference of 7.7%), Hopi (8.1%, a difference of 8.6%), and Yuman (9.6%, a difference of 9.1%).
| Demographics | Rating | Rank | Female Unemployment |
| Menominee | 0.0 /100 | #333 | Tragic 7.0% |
| Immigrants | Armenia | 0.0 /100 | #334 | Tragic 7.1% |
| Dominicans | 0.0 /100 | #335 | Tragic 7.2% |
| Immigrants | Dominican Republic | 0.0 /100 | #336 | Tragic 7.2% |
| Navajo | 0.0 /100 | #337 | Tragic 7.3% |
| Tohono O'odham | 0.0 /100 | #338 | Tragic 7.7% |
| Immigrants | Yemen | 0.0 /100 | #339 | Tragic 7.8% |
| Hopi | 0.0 /100 | #340 | Tragic 8.1% |
| Inupiat | 0.0 /100 | #341 | Tragic 8.2% |
| Puerto Ricans | 0.0 /100 | #342 | Tragic 8.3% |
| Arapaho | 0.0 /100 | #343 | Tragic 8.8% |
| Pima | 0.0 /100 | #344 | Tragic 9.3% |
| Yuman | 0.0 /100 | #345 | Tragic 9.6% |
| Yup'ik | 0.0 /100 | #346 | Tragic 10.9% |
| Crow | 0.0 /100 | #347 | Tragic 12.1% |