Danish vs Arapaho Female Unemployment
COMPARE
Danish
Arapaho
Female Unemployment
Female Unemployment Comparison
Danes
Arapaho
4.4%
FEMALE UNEMPLOYMENT
100.0/ 100
METRIC RATING
4th/ 347
METRIC RANK
8.8%
FEMALE UNEMPLOYMENT
0.0/ 100
METRIC RATING
343rd/ 347
METRIC RANK
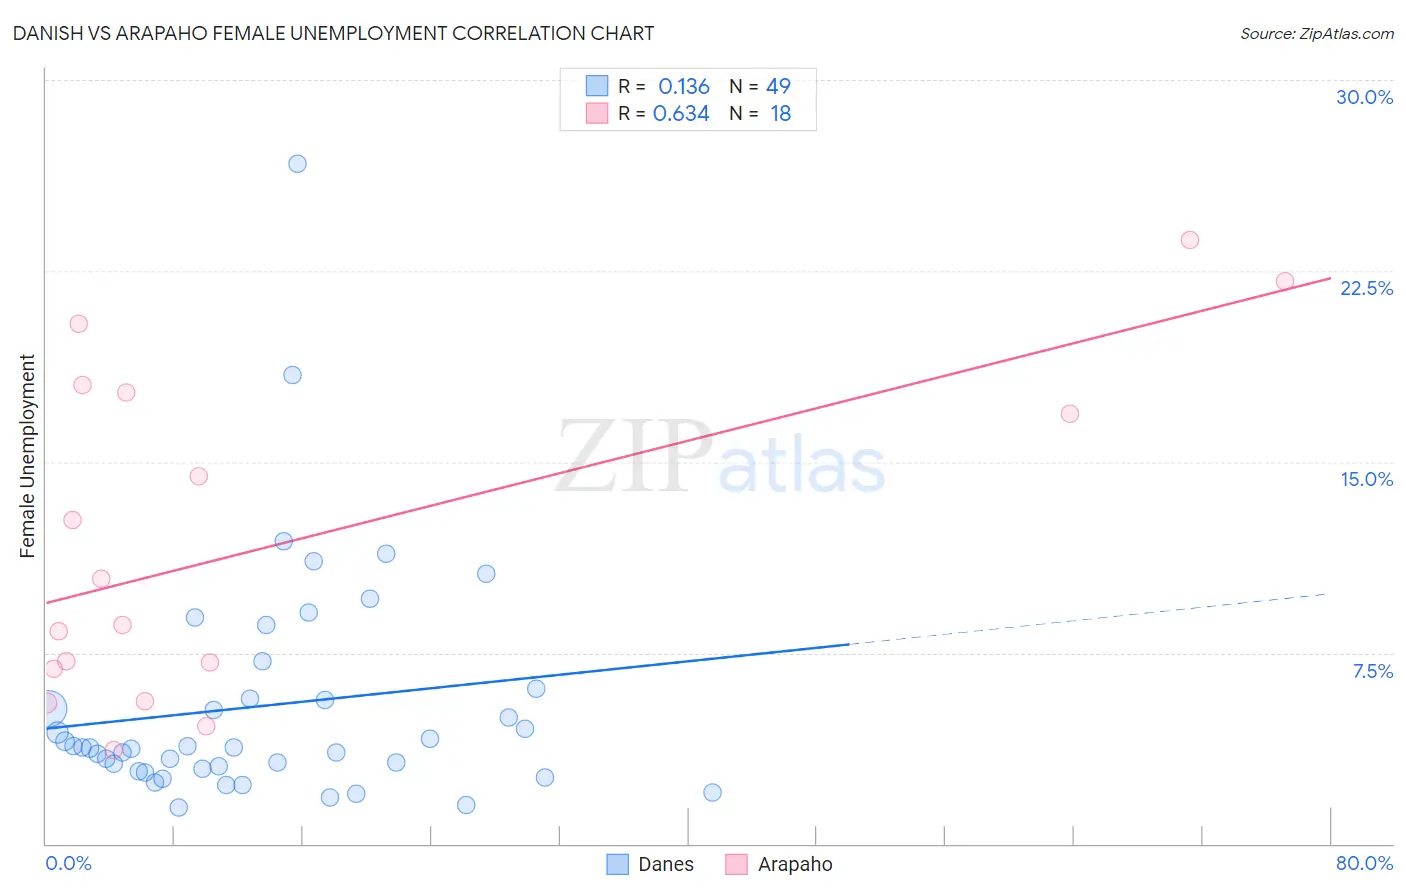
Danish vs Arapaho Female Unemployment Correlation Chart
The statistical analysis conducted on geographies consisting of 467,603,755 people shows a poor positive correlation between the proportion of Danes and unemploymnet rate among females in the United States with a correlation coefficient (R) of 0.136 and weighted average of 4.4%. Similarly, the statistical analysis conducted on geographies consisting of 29,729,190 people shows a significant positive correlation between the proportion of Arapaho and unemploymnet rate among females in the United States with a correlation coefficient (R) of 0.634 and weighted average of 8.8%, a difference of 100.2%.
Female Unemployment Correlation Summary
| Measurement | Danish | Arapaho |
| Minimum | 1.4% | 3.7% |
| Maximum | 26.7% | 23.7% |
| Range | 25.3% | 20.0% |
| Mean | 5.4% | 11.9% |
| Median | 3.8% | 9.5% |
| Interquartile 25% (IQ1) | 2.9% | 6.9% |
| Interquartile 75% (IQ3) | 5.9% | 17.7% |
| Interquartile Range (IQR) | 3.0% | 10.9% |
| Standard Deviation (Sample) | 4.6% | 6.5% |
| Standard Deviation (Population) | 4.5% | 6.3% |
Similar Demographics by Female Unemployment
Demographics Similar to Danes by Female Unemployment
In terms of female unemployment, the demographic groups most similar to Danes are Luxembourger (4.4%, a difference of 0.030%), Czech (4.4%, a difference of 0.040%), Hmong (4.4%, a difference of 0.11%), Swedish (4.4%, a difference of 1.3%), and Chinese (4.5%, a difference of 2.1%).
| Demographics | Rating | Rank | Female Unemployment |
| Norwegians | 100.0 /100 | #1 | Exceptional 4.2% |
| Czechs | 100.0 /100 | #2 | Exceptional 4.4% |
| Luxembourgers | 100.0 /100 | #3 | Exceptional 4.4% |
| Danes | 100.0 /100 | #4 | Exceptional 4.4% |
| Hmong | 100.0 /100 | #5 | Exceptional 4.4% |
| Swedes | 100.0 /100 | #6 | Exceptional 4.4% |
| Chinese | 100.0 /100 | #7 | Exceptional 4.5% |
| Germans | 100.0 /100 | #8 | Exceptional 4.5% |
| Slovenes | 100.0 /100 | #9 | Exceptional 4.5% |
| Swiss | 100.0 /100 | #10 | Exceptional 4.6% |
| Scandinavians | 100.0 /100 | #11 | Exceptional 4.6% |
| Dutch | 100.0 /100 | #12 | Exceptional 4.6% |
| Belgians | 100.0 /100 | #13 | Exceptional 4.6% |
| Finns | 100.0 /100 | #14 | Exceptional 4.6% |
| English | 100.0 /100 | #15 | Exceptional 4.6% |
Demographics Similar to Arapaho by Female Unemployment
In terms of female unemployment, the demographic groups most similar to Arapaho are Puerto Rican (8.3%, a difference of 5.4%), Pima (9.3%, a difference of 6.2%), Inupiat (8.2%, a difference of 7.7%), Hopi (8.1%, a difference of 8.6%), and Yuman (9.6%, a difference of 9.1%).
| Demographics | Rating | Rank | Female Unemployment |
| Menominee | 0.0 /100 | #333 | Tragic 7.0% |
| Immigrants | Armenia | 0.0 /100 | #334 | Tragic 7.1% |
| Dominicans | 0.0 /100 | #335 | Tragic 7.2% |
| Immigrants | Dominican Republic | 0.0 /100 | #336 | Tragic 7.2% |
| Navajo | 0.0 /100 | #337 | Tragic 7.3% |
| Tohono O'odham | 0.0 /100 | #338 | Tragic 7.7% |
| Immigrants | Yemen | 0.0 /100 | #339 | Tragic 7.8% |
| Hopi | 0.0 /100 | #340 | Tragic 8.1% |
| Inupiat | 0.0 /100 | #341 | Tragic 8.2% |
| Puerto Ricans | 0.0 /100 | #342 | Tragic 8.3% |
| Arapaho | 0.0 /100 | #343 | Tragic 8.8% |
| Pima | 0.0 /100 | #344 | Tragic 9.3% |
| Yuman | 0.0 /100 | #345 | Tragic 9.6% |
| Yup'ik | 0.0 /100 | #346 | Tragic 10.9% |
| Crow | 0.0 /100 | #347 | Tragic 12.1% |