Choctaw vs U.S. Virgin Islander Doctorate Degree
COMPARE
Choctaw
U.S. Virgin Islander
Doctorate Degree
Doctorate Degree Comparison
Choctaw
U.S. Virgin Islanders
1.4%
DOCTORATE DEGREE
0.3/ 100
METRIC RATING
290th/ 347
METRIC RANK
1.5%
DOCTORATE DEGREE
0.5/ 100
METRIC RATING
268th/ 347
METRIC RANK
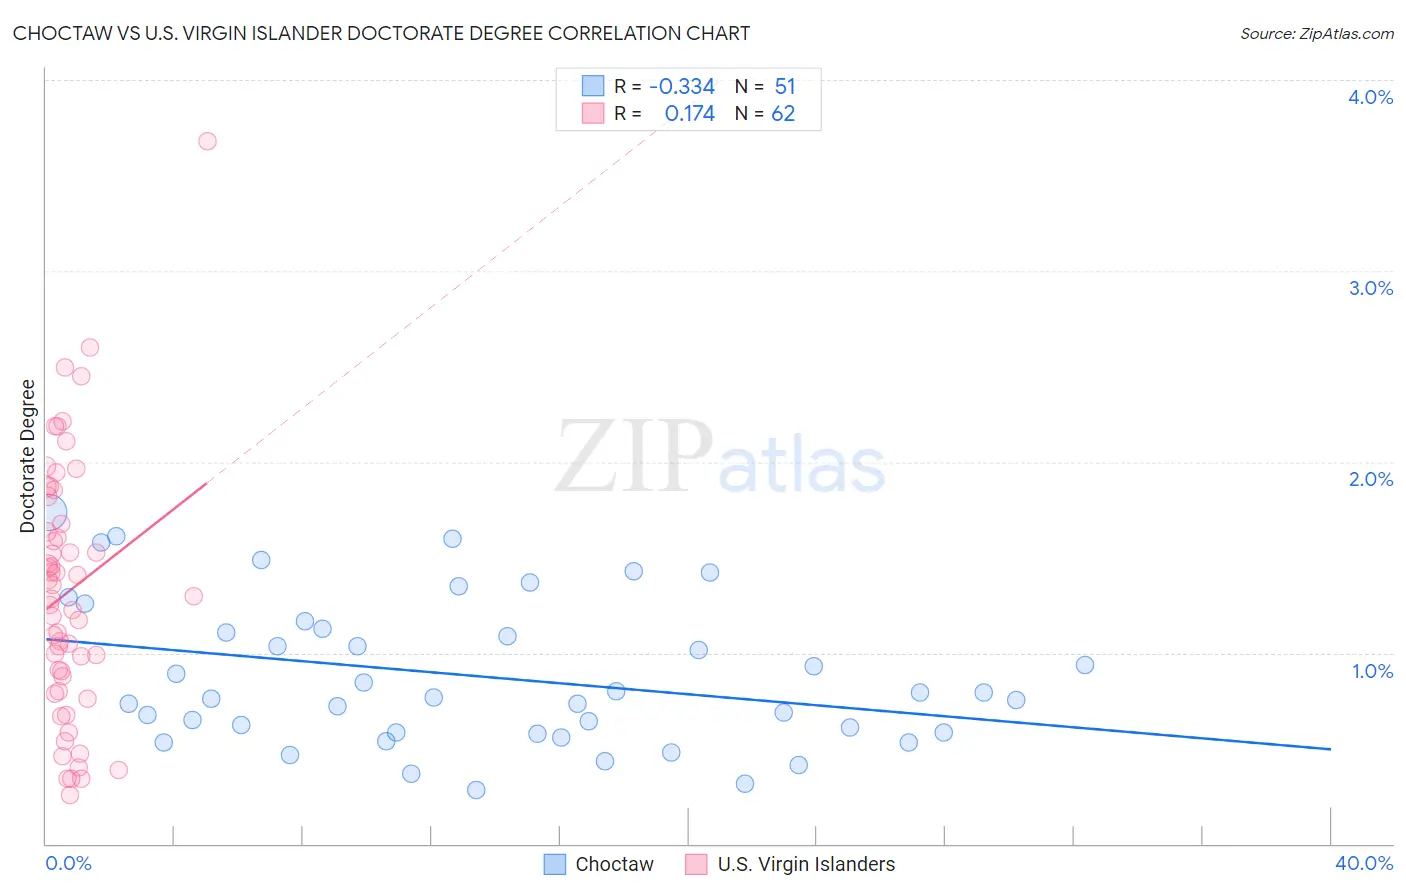
Choctaw vs U.S. Virgin Islander Doctorate Degree Correlation Chart
The statistical analysis conducted on geographies consisting of 265,489,053 people shows a mild negative correlation between the proportion of Choctaw and percentage of population with at least doctorate degree education in the United States with a correlation coefficient (R) of -0.334 and weighted average of 1.4%. Similarly, the statistical analysis conducted on geographies consisting of 87,354,838 people shows a poor positive correlation between the proportion of U.S. Virgin Islanders and percentage of population with at least doctorate degree education in the United States with a correlation coefficient (R) of 0.174 and weighted average of 1.5%, a difference of 2.3%.
Doctorate Degree Correlation Summary
| Measurement | Choctaw | U.S. Virgin Islander |
| Minimum | 0.28% | 0.26% |
| Maximum | 1.7% | 3.7% |
| Range | 1.5% | 3.4% |
| Mean | 0.88% | 1.3% |
| Median | 0.76% | 1.3% |
| Interquartile 25% (IQ1) | 0.59% | 0.87% |
| Interquartile 75% (IQ3) | 1.1% | 1.7% |
| Interquartile Range (IQR) | 0.54% | 0.80% |
| Standard Deviation (Sample) | 0.38% | 0.67% |
| Standard Deviation (Population) | 0.38% | 0.66% |
Similar Demographics by Doctorate Degree
Demographics Similar to Choctaw by Doctorate Degree
In terms of doctorate degree, the demographic groups most similar to Choctaw are Cape Verdean (1.4%, a difference of 0.020%), Immigrants from El Salvador (1.4%, a difference of 0.15%), Black/African American (1.4%, a difference of 0.23%), Cajun (1.5%, a difference of 0.33%), and Alaska Native (1.4%, a difference of 0.40%).
| Demographics | Rating | Rank | Doctorate Degree |
| Central Americans | 0.3 /100 | #283 | Tragic 1.5% |
| Jamaicans | 0.3 /100 | #284 | Tragic 1.5% |
| Malaysians | 0.3 /100 | #285 | Tragic 1.5% |
| Cherokee | 0.3 /100 | #286 | Tragic 1.5% |
| Cajuns | 0.3 /100 | #287 | Tragic 1.5% |
| Immigrants | El Salvador | 0.3 /100 | #288 | Tragic 1.4% |
| Cape Verdeans | 0.3 /100 | #289 | Tragic 1.4% |
| Choctaw | 0.3 /100 | #290 | Tragic 1.4% |
| Blacks/African Americans | 0.3 /100 | #291 | Tragic 1.4% |
| Alaska Natives | 0.3 /100 | #292 | Tragic 1.4% |
| Immigrants | Yemen | 0.2 /100 | #293 | Tragic 1.4% |
| Samoans | 0.2 /100 | #294 | Tragic 1.4% |
| Guatemalans | 0.2 /100 | #295 | Tragic 1.4% |
| Immigrants | Ecuador | 0.2 /100 | #296 | Tragic 1.4% |
| Tsimshian | 0.2 /100 | #297 | Tragic 1.4% |
Demographics Similar to U.S. Virgin Islanders by Doctorate Degree
In terms of doctorate degree, the demographic groups most similar to U.S. Virgin Islanders are Kiowa (1.5%, a difference of 0.0%), Crow (1.5%, a difference of 0.090%), Salvadoran (1.5%, a difference of 0.11%), Immigrants from Trinidad and Tobago (1.5%, a difference of 0.19%), and Immigrants from Barbados (1.5%, a difference of 0.27%).
| Demographics | Rating | Rank | Doctorate Degree |
| Immigrants | Portugal | 0.8 /100 | #261 | Tragic 1.5% |
| Chickasaw | 0.7 /100 | #262 | Tragic 1.5% |
| Immigrants | Bahamas | 0.7 /100 | #263 | Tragic 1.5% |
| Blackfeet | 0.7 /100 | #264 | Tragic 1.5% |
| Nicaraguans | 0.6 /100 | #265 | Tragic 1.5% |
| Immigrants | Liberia | 0.5 /100 | #266 | Tragic 1.5% |
| Kiowa | 0.5 /100 | #267 | Tragic 1.5% |
| U.S. Virgin Islanders | 0.5 /100 | #268 | Tragic 1.5% |
| Crow | 0.5 /100 | #269 | Tragic 1.5% |
| Salvadorans | 0.5 /100 | #270 | Tragic 1.5% |
| Immigrants | Trinidad and Tobago | 0.5 /100 | #271 | Tragic 1.5% |
| Immigrants | Barbados | 0.4 /100 | #272 | Tragic 1.5% |
| Sioux | 0.4 /100 | #273 | Tragic 1.5% |
| Yaqui | 0.4 /100 | #274 | Tragic 1.5% |
| Aleuts | 0.4 /100 | #275 | Tragic 1.5% |