Chinese vs Native/Alaskan Female Unemployment
COMPARE
Chinese
Native/Alaskan
Female Unemployment
Female Unemployment Comparison
Chinese
Natives/Alaskans
4.5%
FEMALE UNEMPLOYMENT
100.0/ 100
METRIC RATING
7th/ 347
METRIC RANK
6.6%
FEMALE UNEMPLOYMENT
0.0/ 100
METRIC RATING
326th/ 347
METRIC RANK
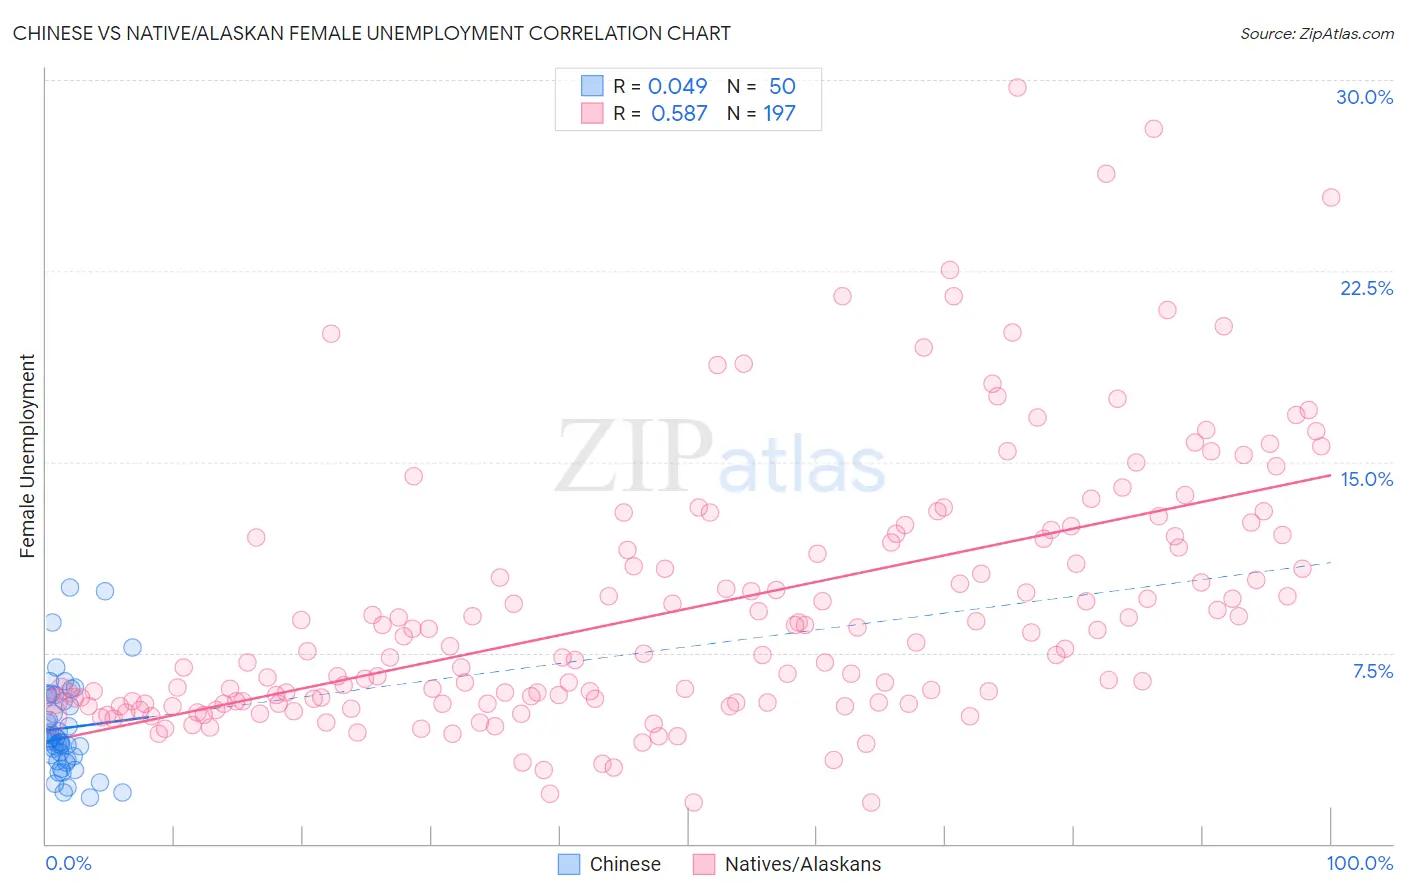
Chinese vs Native/Alaskan Female Unemployment Correlation Chart
The statistical analysis conducted on geographies consisting of 64,725,695 people shows no correlation between the proportion of Chinese and unemploymnet rate among females in the United States with a correlation coefficient (R) of 0.049 and weighted average of 4.5%. Similarly, the statistical analysis conducted on geographies consisting of 506,227,982 people shows a substantial positive correlation between the proportion of Natives/Alaskans and unemploymnet rate among females in the United States with a correlation coefficient (R) of 0.587 and weighted average of 6.6%, a difference of 47.8%.
Female Unemployment Correlation Summary
| Measurement | Chinese | Native/Alaskan |
| Minimum | 1.8% | 1.6% |
| Maximum | 10.0% | 29.7% |
| Range | 8.2% | 28.1% |
| Mean | 4.5% | 9.2% |
| Median | 4.1% | 7.5% |
| Interquartile 25% (IQ1) | 3.3% | 5.5% |
| Interquartile 75% (IQ3) | 5.8% | 12.0% |
| Interquartile Range (IQR) | 2.5% | 6.5% |
| Standard Deviation (Sample) | 1.9% | 5.2% |
| Standard Deviation (Population) | 1.9% | 5.2% |
Similar Demographics by Female Unemployment
Demographics Similar to Chinese by Female Unemployment
In terms of female unemployment, the demographic groups most similar to Chinese are German (4.5%, a difference of 0.020%), Slovene (4.5%, a difference of 0.38%), Swedish (4.4%, a difference of 0.77%), Swiss (4.6%, a difference of 1.7%), and Scandinavian (4.6%, a difference of 1.8%).
| Demographics | Rating | Rank | Female Unemployment |
| Norwegians | 100.0 /100 | #1 | Exceptional 4.2% |
| Czechs | 100.0 /100 | #2 | Exceptional 4.4% |
| Luxembourgers | 100.0 /100 | #3 | Exceptional 4.4% |
| Danes | 100.0 /100 | #4 | Exceptional 4.4% |
| Hmong | 100.0 /100 | #5 | Exceptional 4.4% |
| Swedes | 100.0 /100 | #6 | Exceptional 4.4% |
| Chinese | 100.0 /100 | #7 | Exceptional 4.5% |
| Germans | 100.0 /100 | #8 | Exceptional 4.5% |
| Slovenes | 100.0 /100 | #9 | Exceptional 4.5% |
| Swiss | 100.0 /100 | #10 | Exceptional 4.6% |
| Scandinavians | 100.0 /100 | #11 | Exceptional 4.6% |
| Dutch | 100.0 /100 | #12 | Exceptional 4.6% |
| Belgians | 100.0 /100 | #13 | Exceptional 4.6% |
| Finns | 100.0 /100 | #14 | Exceptional 4.6% |
| English | 100.0 /100 | #15 | Exceptional 4.6% |
Demographics Similar to Natives/Alaskans by Female Unemployment
In terms of female unemployment, the demographic groups most similar to Natives/Alaskans are Alaska Native (6.6%, a difference of 0.090%), Guyanese (6.7%, a difference of 0.52%), Apache (6.6%, a difference of 0.56%), Cheyenne (6.6%, a difference of 0.83%), and Immigrants from Guyana (6.7%, a difference of 0.89%).
| Demographics | Rating | Rank | Female Unemployment |
| Immigrants | Bangladesh | 0.0 /100 | #319 | Tragic 6.5% |
| Immigrants | Dominica | 0.0 /100 | #320 | Tragic 6.5% |
| Blacks/African Americans | 0.0 /100 | #321 | Tragic 6.5% |
| Vietnamese | 0.0 /100 | #322 | Tragic 6.5% |
| Immigrants | Belize | 0.0 /100 | #323 | Tragic 6.5% |
| Cheyenne | 0.0 /100 | #324 | Tragic 6.6% |
| Apache | 0.0 /100 | #325 | Tragic 6.6% |
| Natives/Alaskans | 0.0 /100 | #326 | Tragic 6.6% |
| Alaska Natives | 0.0 /100 | #327 | Tragic 6.6% |
| Guyanese | 0.0 /100 | #328 | Tragic 6.7% |
| Immigrants | Guyana | 0.0 /100 | #329 | Tragic 6.7% |
| Yakama | 0.0 /100 | #330 | Tragic 6.7% |
| Paiute | 0.0 /100 | #331 | Tragic 6.8% |
| Sioux | 0.0 /100 | #332 | Tragic 7.0% |
| Menominee | 0.0 /100 | #333 | Tragic 7.0% |