Chinese vs Eastern European Female Unemployment
COMPARE
Chinese
Eastern European
Female Unemployment
Female Unemployment Comparison
Chinese
Eastern Europeans
4.5%
FEMALE UNEMPLOYMENT
100.0/ 100
METRIC RATING
7th/ 347
METRIC RANK
4.9%
FEMALE UNEMPLOYMENT
99.4/ 100
METRIC RATING
43rd/ 347
METRIC RANK
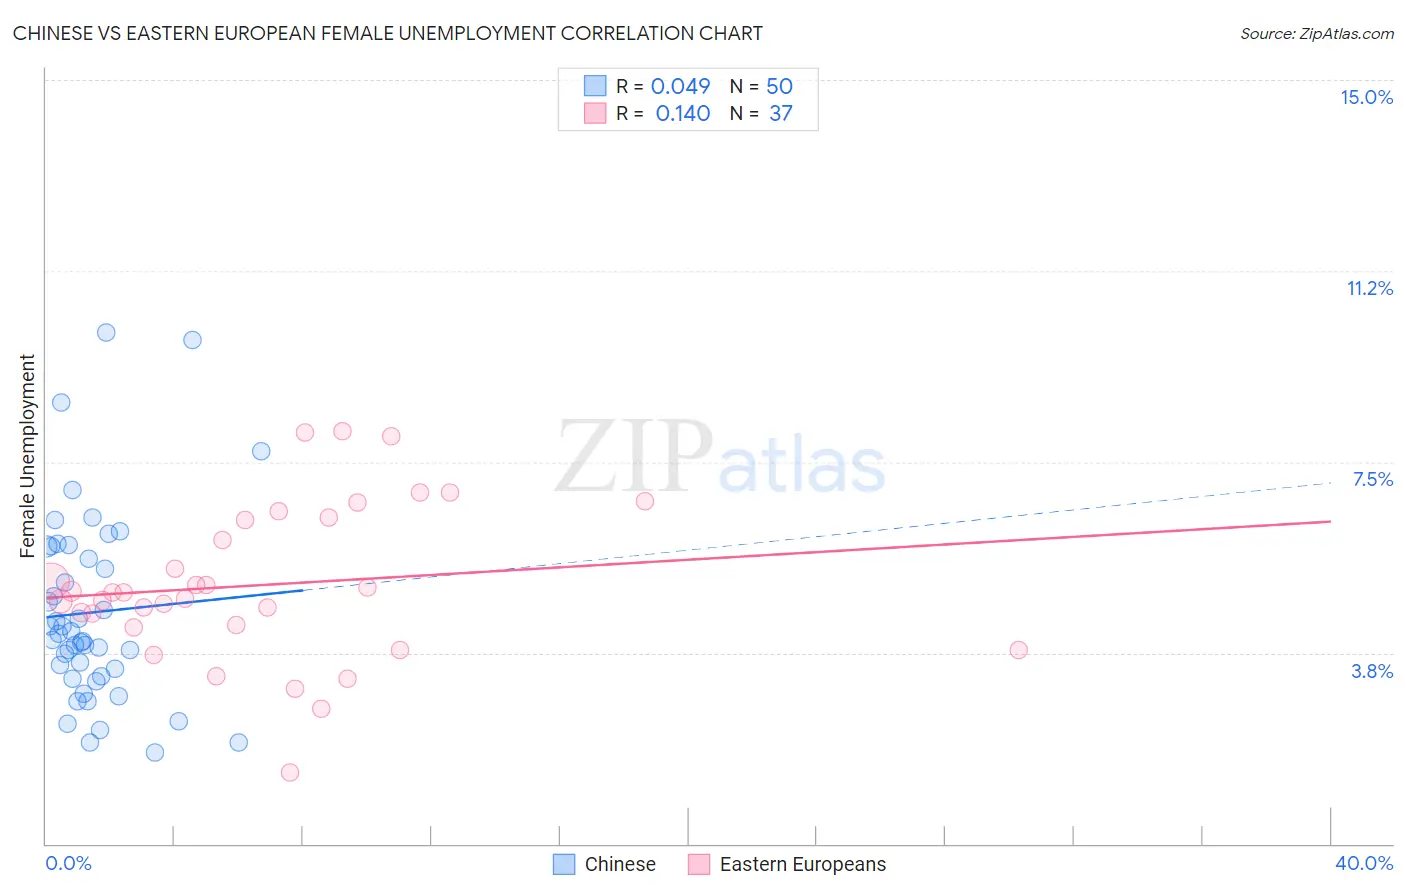
Chinese vs Eastern European Female Unemployment Correlation Chart
The statistical analysis conducted on geographies consisting of 64,725,695 people shows no correlation between the proportion of Chinese and unemploymnet rate among females in the United States with a correlation coefficient (R) of 0.049 and weighted average of 4.5%. Similarly, the statistical analysis conducted on geographies consisting of 456,874,876 people shows a poor positive correlation between the proportion of Eastern Europeans and unemploymnet rate among females in the United States with a correlation coefficient (R) of 0.140 and weighted average of 4.9%, a difference of 8.2%.
Female Unemployment Correlation Summary
| Measurement | Chinese | Eastern European |
| Minimum | 1.8% | 1.4% |
| Maximum | 10.0% | 8.1% |
| Range | 8.2% | 6.7% |
| Mean | 4.5% | 5.1% |
| Median | 4.1% | 4.9% |
| Interquartile 25% (IQ1) | 3.3% | 4.3% |
| Interquartile 75% (IQ3) | 5.8% | 6.4% |
| Interquartile Range (IQR) | 2.5% | 2.1% |
| Standard Deviation (Sample) | 1.9% | 1.5% |
| Standard Deviation (Population) | 1.9% | 1.5% |
Similar Demographics by Female Unemployment
Demographics Similar to Chinese by Female Unemployment
In terms of female unemployment, the demographic groups most similar to Chinese are German (4.5%, a difference of 0.020%), Slovene (4.5%, a difference of 0.38%), Swedish (4.4%, a difference of 0.77%), Swiss (4.6%, a difference of 1.7%), and Scandinavian (4.6%, a difference of 1.8%).
| Demographics | Rating | Rank | Female Unemployment |
| Norwegians | 100.0 /100 | #1 | Exceptional 4.2% |
| Czechs | 100.0 /100 | #2 | Exceptional 4.4% |
| Luxembourgers | 100.0 /100 | #3 | Exceptional 4.4% |
| Danes | 100.0 /100 | #4 | Exceptional 4.4% |
| Hmong | 100.0 /100 | #5 | Exceptional 4.4% |
| Swedes | 100.0 /100 | #6 | Exceptional 4.4% |
| Chinese | 100.0 /100 | #7 | Exceptional 4.5% |
| Germans | 100.0 /100 | #8 | Exceptional 4.5% |
| Slovenes | 100.0 /100 | #9 | Exceptional 4.5% |
| Swiss | 100.0 /100 | #10 | Exceptional 4.6% |
| Scandinavians | 100.0 /100 | #11 | Exceptional 4.6% |
| Dutch | 100.0 /100 | #12 | Exceptional 4.6% |
| Belgians | 100.0 /100 | #13 | Exceptional 4.6% |
| Finns | 100.0 /100 | #14 | Exceptional 4.6% |
| English | 100.0 /100 | #15 | Exceptional 4.6% |
Demographics Similar to Eastern Europeans by Female Unemployment
In terms of female unemployment, the demographic groups most similar to Eastern Europeans are Greek (4.9%, a difference of 0.11%), Italian (4.8%, a difference of 0.17%), Austrian (4.9%, a difference of 0.18%), Immigrants from Bulgaria (4.9%, a difference of 0.21%), and Okinawan (4.9%, a difference of 0.29%).
| Demographics | Rating | Rank | Female Unemployment |
| Yugoslavians | 99.7 /100 | #36 | Exceptional 4.8% |
| Pennsylvania Germans | 99.6 /100 | #37 | Exceptional 4.8% |
| Northern Europeans | 99.6 /100 | #38 | Exceptional 4.8% |
| Scotch-Irish | 99.6 /100 | #39 | Exceptional 4.8% |
| French | 99.6 /100 | #40 | Exceptional 4.8% |
| Tongans | 99.5 /100 | #41 | Exceptional 4.8% |
| Italians | 99.5 /100 | #42 | Exceptional 4.8% |
| Eastern Europeans | 99.4 /100 | #43 | Exceptional 4.9% |
| Greeks | 99.4 /100 | #44 | Exceptional 4.9% |
| Austrians | 99.3 /100 | #45 | Exceptional 4.9% |
| Immigrants | Bulgaria | 99.3 /100 | #46 | Exceptional 4.9% |
| Okinawans | 99.3 /100 | #47 | Exceptional 4.9% |
| Thais | 99.2 /100 | #48 | Exceptional 4.9% |
| Australians | 99.2 /100 | #49 | Exceptional 4.9% |
| Immigrants | Cuba | 99.1 /100 | #50 | Exceptional 4.9% |