Chinese vs Kenyan Female Unemployment
COMPARE
Chinese
Kenyan
Female Unemployment
Female Unemployment Comparison
Chinese
Kenyans
4.5%
FEMALE UNEMPLOYMENT
100.0/ 100
METRIC RATING
7th/ 347
METRIC RANK
5.0%
FEMALE UNEMPLOYMENT
93.7/ 100
METRIC RATING
104th/ 347
METRIC RANK
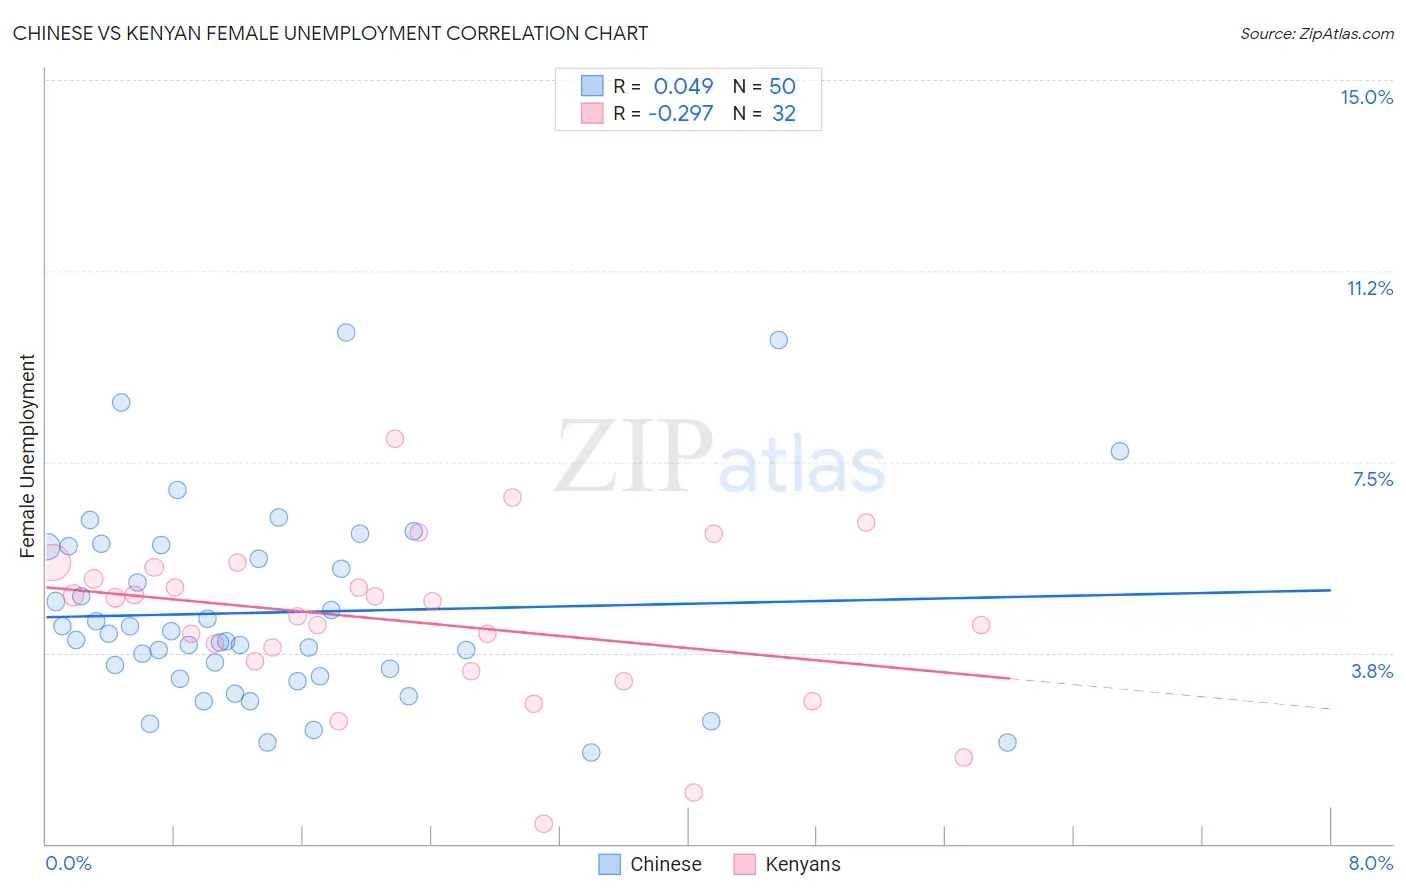
Chinese vs Kenyan Female Unemployment Correlation Chart
The statistical analysis conducted on geographies consisting of 64,725,695 people shows no correlation between the proportion of Chinese and unemploymnet rate among females in the United States with a correlation coefficient (R) of 0.049 and weighted average of 4.5%. Similarly, the statistical analysis conducted on geographies consisting of 168,081,241 people shows a weak negative correlation between the proportion of Kenyans and unemploymnet rate among females in the United States with a correlation coefficient (R) of -0.297 and weighted average of 5.0%, a difference of 12.5%.
Female Unemployment Correlation Summary
| Measurement | Chinese | Kenyan |
| Minimum | 1.8% | 0.40% |
| Maximum | 10.0% | 7.9% |
| Range | 8.2% | 7.5% |
| Mean | 4.5% | 4.4% |
| Median | 4.1% | 4.6% |
| Interquartile 25% (IQ1) | 3.3% | 3.5% |
| Interquartile 75% (IQ3) | 5.8% | 5.3% |
| Interquartile Range (IQR) | 2.5% | 1.8% |
| Standard Deviation (Sample) | 1.9% | 1.6% |
| Standard Deviation (Population) | 1.9% | 1.6% |
Similar Demographics by Female Unemployment
Demographics Similar to Chinese by Female Unemployment
In terms of female unemployment, the demographic groups most similar to Chinese are German (4.5%, a difference of 0.020%), Slovene (4.5%, a difference of 0.38%), Swedish (4.4%, a difference of 0.77%), Swiss (4.6%, a difference of 1.7%), and Scandinavian (4.6%, a difference of 1.8%).
| Demographics | Rating | Rank | Female Unemployment |
| Norwegians | 100.0 /100 | #1 | Exceptional 4.2% |
| Czechs | 100.0 /100 | #2 | Exceptional 4.4% |
| Luxembourgers | 100.0 /100 | #3 | Exceptional 4.4% |
| Danes | 100.0 /100 | #4 | Exceptional 4.4% |
| Hmong | 100.0 /100 | #5 | Exceptional 4.4% |
| Swedes | 100.0 /100 | #6 | Exceptional 4.4% |
| Chinese | 100.0 /100 | #7 | Exceptional 4.5% |
| Germans | 100.0 /100 | #8 | Exceptional 4.5% |
| Slovenes | 100.0 /100 | #9 | Exceptional 4.5% |
| Swiss | 100.0 /100 | #10 | Exceptional 4.6% |
| Scandinavians | 100.0 /100 | #11 | Exceptional 4.6% |
| Dutch | 100.0 /100 | #12 | Exceptional 4.6% |
| Belgians | 100.0 /100 | #13 | Exceptional 4.6% |
| Finns | 100.0 /100 | #14 | Exceptional 4.6% |
| English | 100.0 /100 | #15 | Exceptional 4.6% |
Demographics Similar to Kenyans by Female Unemployment
In terms of female unemployment, the demographic groups most similar to Kenyans are Immigrants from England (5.0%, a difference of 0.020%), Paraguayan (5.1%, a difference of 0.12%), Immigrants from Switzerland (5.1%, a difference of 0.15%), Puget Sound Salish (5.1%, a difference of 0.17%), and Immigrants from Eastern Africa (5.1%, a difference of 0.21%).
| Demographics | Rating | Rank | Female Unemployment |
| Immigrants | Somalia | 95.2 /100 | #97 | Exceptional 5.0% |
| Immigrants | Kuwait | 95.2 /100 | #98 | Exceptional 5.0% |
| Immigrants | Zaire | 95.2 /100 | #99 | Exceptional 5.0% |
| Indonesians | 95.1 /100 | #100 | Exceptional 5.0% |
| Immigrants | Czechoslovakia | 95.0 /100 | #101 | Exceptional 5.0% |
| Immigrants | Kenya | 94.8 /100 | #102 | Exceptional 5.0% |
| Somalis | 94.6 /100 | #103 | Exceptional 5.0% |
| Kenyans | 93.7 /100 | #104 | Exceptional 5.0% |
| Immigrants | England | 93.6 /100 | #105 | Exceptional 5.0% |
| Paraguayans | 93.2 /100 | #106 | Exceptional 5.1% |
| Immigrants | Switzerland | 93.1 /100 | #107 | Exceptional 5.1% |
| Puget Sound Salish | 93.0 /100 | #108 | Exceptional 5.1% |
| Immigrants | Eastern Africa | 92.8 /100 | #109 | Exceptional 5.1% |
| Macedonians | 92.4 /100 | #110 | Exceptional 5.1% |
| Immigrants | Burma/Myanmar | 92.3 /100 | #111 | Exceptional 5.1% |