Chickasaw vs Immigrants from Honduras Female Unemployment
COMPARE
Chickasaw
Immigrants from Honduras
Female Unemployment
Female Unemployment Comparison
Chickasaw
Immigrants from Honduras
5.1%
FEMALE UNEMPLOYMENT
83.2/ 100
METRIC RATING
138th/ 347
METRIC RANK
5.9%
FEMALE UNEMPLOYMENT
0.0/ 100
METRIC RATING
270th/ 347
METRIC RANK
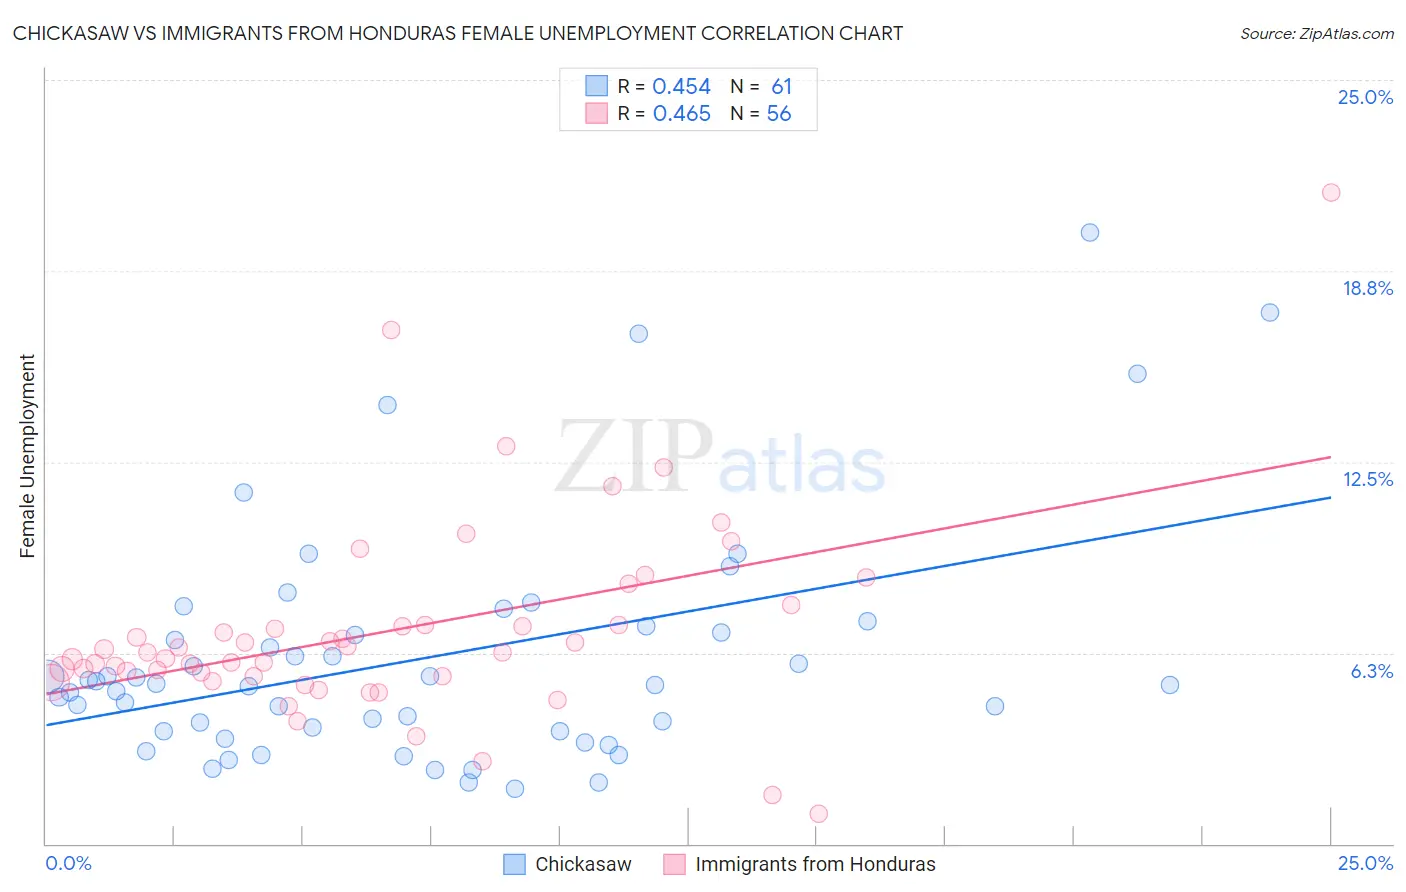
Chickasaw vs Immigrants from Honduras Female Unemployment Correlation Chart
The statistical analysis conducted on geographies consisting of 147,184,773 people shows a moderate positive correlation between the proportion of Chickasaw and unemploymnet rate among females in the United States with a correlation coefficient (R) of 0.454 and weighted average of 5.1%. Similarly, the statistical analysis conducted on geographies consisting of 321,601,293 people shows a moderate positive correlation between the proportion of Immigrants from Honduras and unemploymnet rate among females in the United States with a correlation coefficient (R) of 0.465 and weighted average of 5.9%, a difference of 15.5%.
Female Unemployment Correlation Summary
| Measurement | Chickasaw | Immigrants from Honduras |
| Minimum | 1.8% | 1.0% |
| Maximum | 20.0% | 21.3% |
| Range | 18.2% | 20.3% |
| Mean | 6.1% | 7.0% |
| Median | 5.2% | 6.3% |
| Interquartile 25% (IQ1) | 3.7% | 5.5% |
| Interquartile 75% (IQ3) | 7.0% | 7.1% |
| Interquartile Range (IQR) | 3.3% | 1.6% |
| Standard Deviation (Sample) | 3.8% | 3.3% |
| Standard Deviation (Population) | 3.8% | 3.3% |
Similar Demographics by Female Unemployment
Demographics Similar to Chickasaw by Female Unemployment
In terms of female unemployment, the demographic groups most similar to Chickasaw are Immigrants from Eastern Asia (5.1%, a difference of 0.020%), Pakistani (5.1%, a difference of 0.060%), Immigrants from France (5.1%, a difference of 0.060%), Indian (Asian) (5.1%, a difference of 0.11%), and Immigrants from Latvia (5.1%, a difference of 0.15%).
| Demographics | Rating | Rank | Female Unemployment |
| Immigrants | Ethiopia | 85.4 /100 | #131 | Excellent 5.1% |
| Immigrants | Sri Lanka | 85.0 /100 | #132 | Excellent 5.1% |
| Immigrants | Hong Kong | 84.8 /100 | #133 | Excellent 5.1% |
| Immigrants | Eritrea | 84.6 /100 | #134 | Excellent 5.1% |
| Immigrants | Latvia | 84.6 /100 | #135 | Excellent 5.1% |
| Indians (Asian) | 84.2 /100 | #136 | Excellent 5.1% |
| Pakistanis | 83.8 /100 | #137 | Excellent 5.1% |
| Chickasaw | 83.2 /100 | #138 | Excellent 5.1% |
| Immigrants | Eastern Asia | 83.0 /100 | #139 | Excellent 5.1% |
| Immigrants | France | 82.7 /100 | #140 | Excellent 5.1% |
| Immigrants | Eastern Europe | 81.5 /100 | #141 | Excellent 5.1% |
| Palestinians | 80.8 /100 | #142 | Excellent 5.1% |
| Immigrants | Kazakhstan | 80.7 /100 | #143 | Excellent 5.1% |
| Immigrants | Jordan | 80.4 /100 | #144 | Excellent 5.1% |
| Immigrants | Oceania | 79.5 /100 | #145 | Good 5.2% |
Demographics Similar to Immigrants from Honduras by Female Unemployment
In terms of female unemployment, the demographic groups most similar to Immigrants from Honduras are Central American (5.9%, a difference of 0.10%), Lumbee (5.9%, a difference of 0.29%), Ghanaian (5.9%, a difference of 0.30%), African (5.9%, a difference of 0.38%), and Immigrants from Western Africa (5.9%, a difference of 0.41%).
| Demographics | Rating | Rank | Female Unemployment |
| Immigrants | Azores | 0.1 /100 | #263 | Tragic 5.8% |
| Immigrants | Bahamas | 0.1 /100 | #264 | Tragic 5.8% |
| Blackfeet | 0.0 /100 | #265 | Tragic 5.9% |
| Cape Verdeans | 0.0 /100 | #266 | Tragic 5.9% |
| Nepalese | 0.0 /100 | #267 | Tragic 5.9% |
| Hondurans | 0.0 /100 | #268 | Tragic 5.9% |
| Immigrants | Western Africa | 0.0 /100 | #269 | Tragic 5.9% |
| Immigrants | Honduras | 0.0 /100 | #270 | Tragic 5.9% |
| Central Americans | 0.0 /100 | #271 | Tragic 5.9% |
| Lumbee | 0.0 /100 | #272 | Tragic 5.9% |
| Ghanaians | 0.0 /100 | #273 | Tragic 5.9% |
| Africans | 0.0 /100 | #274 | Tragic 5.9% |
| Senegalese | 0.0 /100 | #275 | Tragic 6.0% |
| Bahamians | 0.0 /100 | #276 | Tragic 6.0% |
| Immigrants | Ghana | 0.0 /100 | #277 | Tragic 6.0% |