Chickasaw vs Tsimshian Female Unemployment
COMPARE
Chickasaw
Tsimshian
Female Unemployment
Female Unemployment Comparison
Chickasaw
Tsimshian
5.1%
FEMALE UNEMPLOYMENT
83.2/ 100
METRIC RATING
138th/ 347
METRIC RANK
5.4%
FEMALE UNEMPLOYMENT
23.1/ 100
METRIC RATING
198th/ 347
METRIC RANK
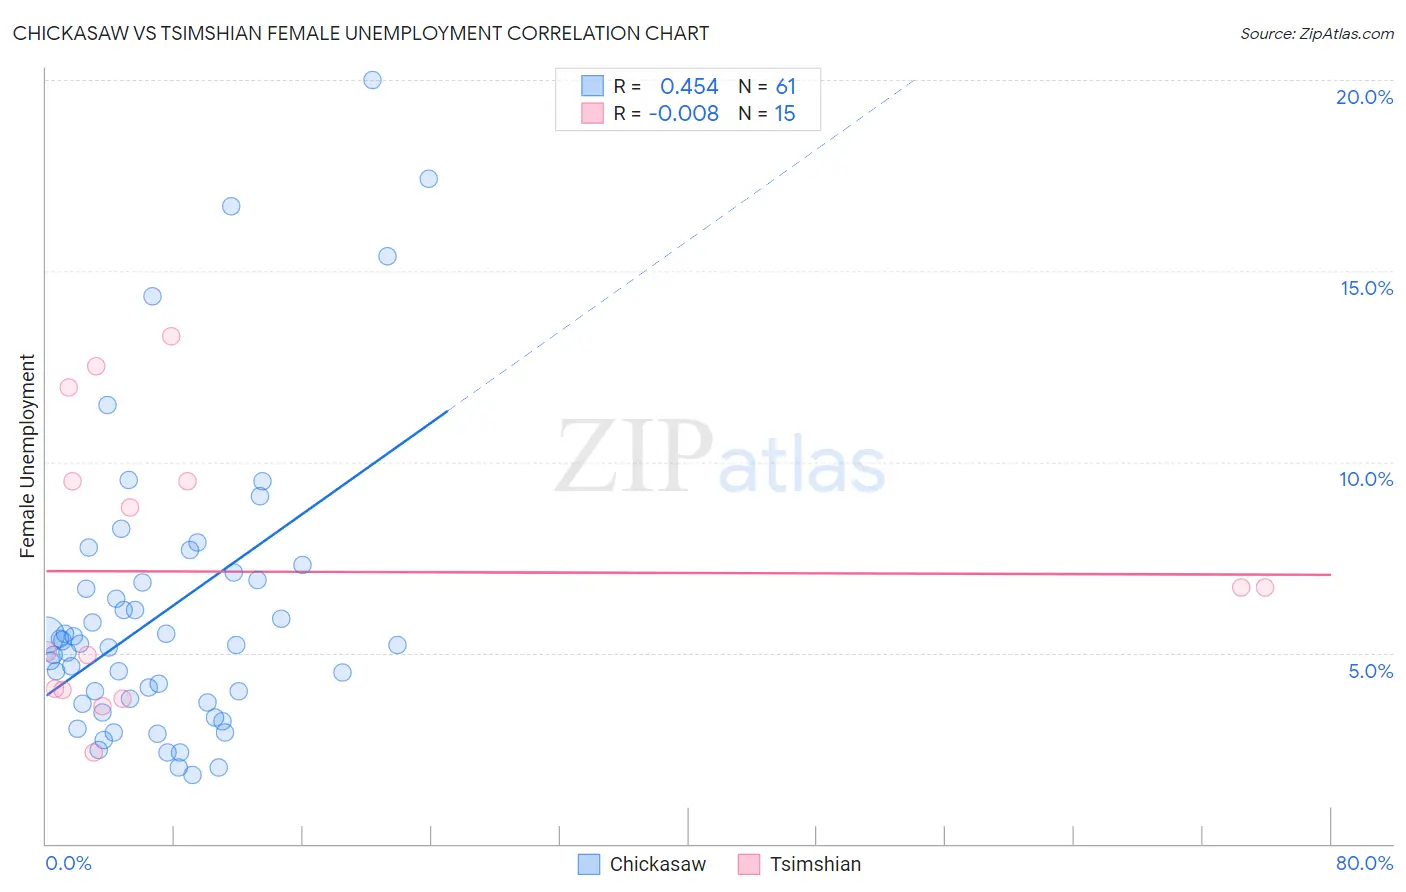
Chickasaw vs Tsimshian Female Unemployment Correlation Chart
The statistical analysis conducted on geographies consisting of 147,184,773 people shows a moderate positive correlation between the proportion of Chickasaw and unemploymnet rate among females in the United States with a correlation coefficient (R) of 0.454 and weighted average of 5.1%. Similarly, the statistical analysis conducted on geographies consisting of 15,620,666 people shows no correlation between the proportion of Tsimshian and unemploymnet rate among females in the United States with a correlation coefficient (R) of -0.008 and weighted average of 5.4%, a difference of 4.3%.
Female Unemployment Correlation Summary
| Measurement | Chickasaw | Tsimshian |
| Minimum | 1.8% | 2.4% |
| Maximum | 20.0% | 13.3% |
| Range | 18.2% | 10.9% |
| Mean | 6.1% | 7.1% |
| Median | 5.2% | 6.7% |
| Interquartile 25% (IQ1) | 3.7% | 4.0% |
| Interquartile 75% (IQ3) | 7.0% | 9.5% |
| Interquartile Range (IQR) | 3.3% | 5.5% |
| Standard Deviation (Sample) | 3.8% | 3.6% |
| Standard Deviation (Population) | 3.8% | 3.4% |
Similar Demographics by Female Unemployment
Demographics Similar to Chickasaw by Female Unemployment
In terms of female unemployment, the demographic groups most similar to Chickasaw are Immigrants from Eastern Asia (5.1%, a difference of 0.020%), Pakistani (5.1%, a difference of 0.060%), Immigrants from France (5.1%, a difference of 0.060%), Indian (Asian) (5.1%, a difference of 0.11%), and Immigrants from Latvia (5.1%, a difference of 0.15%).
| Demographics | Rating | Rank | Female Unemployment |
| Immigrants | Ethiopia | 85.4 /100 | #131 | Excellent 5.1% |
| Immigrants | Sri Lanka | 85.0 /100 | #132 | Excellent 5.1% |
| Immigrants | Hong Kong | 84.8 /100 | #133 | Excellent 5.1% |
| Immigrants | Eritrea | 84.6 /100 | #134 | Excellent 5.1% |
| Immigrants | Latvia | 84.6 /100 | #135 | Excellent 5.1% |
| Indians (Asian) | 84.2 /100 | #136 | Excellent 5.1% |
| Pakistanis | 83.8 /100 | #137 | Excellent 5.1% |
| Chickasaw | 83.2 /100 | #138 | Excellent 5.1% |
| Immigrants | Eastern Asia | 83.0 /100 | #139 | Excellent 5.1% |
| Immigrants | France | 82.7 /100 | #140 | Excellent 5.1% |
| Immigrants | Eastern Europe | 81.5 /100 | #141 | Excellent 5.1% |
| Palestinians | 80.8 /100 | #142 | Excellent 5.1% |
| Immigrants | Kazakhstan | 80.7 /100 | #143 | Excellent 5.1% |
| Immigrants | Jordan | 80.4 /100 | #144 | Excellent 5.1% |
| Immigrants | Oceania | 79.5 /100 | #145 | Good 5.2% |
Demographics Similar to Tsimshian by Female Unemployment
In terms of female unemployment, the demographic groups most similar to Tsimshian are Alsatian (5.3%, a difference of 0.070%), Hawaiian (5.4%, a difference of 0.080%), Soviet Union (5.4%, a difference of 0.12%), Spaniard (5.3%, a difference of 0.17%), and Immigrants from Middle Africa (5.4%, a difference of 0.20%).
| Demographics | Rating | Rank | Female Unemployment |
| Cherokee | 30.8 /100 | #191 | Fair 5.3% |
| Portuguese | 28.6 /100 | #192 | Fair 5.3% |
| Arabs | 27.7 /100 | #193 | Fair 5.3% |
| Colombians | 27.0 /100 | #194 | Fair 5.3% |
| Immigrants | Colombia | 26.2 /100 | #195 | Fair 5.3% |
| Spaniards | 25.2 /100 | #196 | Fair 5.3% |
| Alsatians | 23.9 /100 | #197 | Fair 5.3% |
| Tsimshian | 23.1 /100 | #198 | Fair 5.4% |
| Hawaiians | 22.2 /100 | #199 | Fair 5.4% |
| Soviet Union | 21.7 /100 | #200 | Fair 5.4% |
| Immigrants | Middle Africa | 20.8 /100 | #201 | Fair 5.4% |
| Iroquois | 20.8 /100 | #202 | Fair 5.4% |
| Immigrants | South Eastern Asia | 20.3 /100 | #203 | Fair 5.4% |
| Immigrants | Israel | 19.7 /100 | #204 | Poor 5.4% |
| Immigrants | Afghanistan | 18.9 /100 | #205 | Poor 5.4% |