Lumbee vs Immigrants from Korea Unemployment
COMPARE
Lumbee
Immigrants from Korea
Unemployment
Unemployment Comparison
Lumbee
Immigrants from Korea
6.4%
UNEMPLOYMENT
0.0/ 100
METRIC RATING
306th/ 347
METRIC RANK
5.0%
UNEMPLOYMENT
96.6/ 100
METRIC RATING
88th/ 347
METRIC RANK
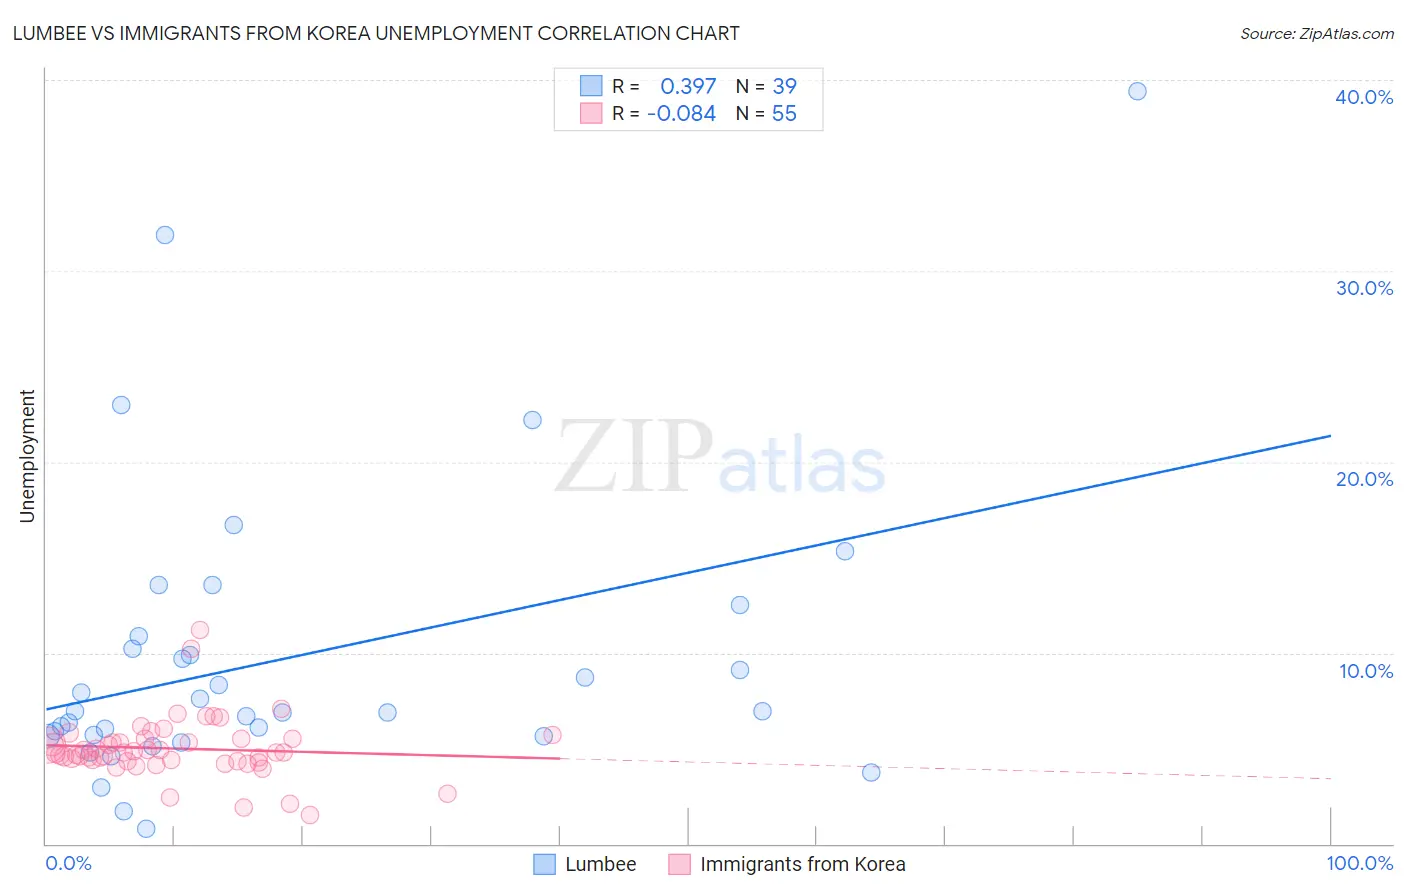
Lumbee vs Immigrants from Korea Unemployment Correlation Chart
The statistical analysis conducted on geographies consisting of 92,248,032 people shows a mild positive correlation between the proportion of Lumbee and unemployment in the United States with a correlation coefficient (R) of 0.397 and weighted average of 6.4%. Similarly, the statistical analysis conducted on geographies consisting of 415,935,417 people shows a slight negative correlation between the proportion of Immigrants from Korea and unemployment in the United States with a correlation coefficient (R) of -0.084 and weighted average of 5.0%, a difference of 29.1%.
Unemployment Correlation Summary
| Measurement | Lumbee | Immigrants from Korea |
| Minimum | 0.80% | 1.5% |
| Maximum | 39.4% | 11.2% |
| Range | 38.6% | 9.7% |
| Mean | 9.8% | 5.0% |
| Median | 6.9% | 4.8% |
| Interquartile 25% (IQ1) | 5.6% | 4.3% |
| Interquartile 75% (IQ3) | 10.9% | 5.5% |
| Interquartile Range (IQR) | 5.2% | 1.2% |
| Standard Deviation (Sample) | 7.8% | 1.6% |
| Standard Deviation (Population) | 7.7% | 1.6% |
Similar Demographics by Unemployment
Demographics Similar to Lumbee by Unemployment
In terms of unemployment, the demographic groups most similar to Lumbee are Menominee (6.4%, a difference of 0.030%), Immigrants from Jamaica (6.4%, a difference of 0.29%), Immigrants from Bangladesh (6.5%, a difference of 0.48%), Barbadian (6.5%, a difference of 0.86%), and Vietnamese (6.5%, a difference of 0.87%).
| Demographics | Rating | Rank | Unemployment |
| Immigrants | West Indies | 0.0 /100 | #299 | Tragic 6.3% |
| Immigrants | Trinidad and Tobago | 0.0 /100 | #300 | Tragic 6.3% |
| Trinidadians and Tobagonians | 0.0 /100 | #301 | Tragic 6.3% |
| West Indians | 0.0 /100 | #302 | Tragic 6.4% |
| Belizeans | 0.0 /100 | #303 | Tragic 6.4% |
| Immigrants | Jamaica | 0.0 /100 | #304 | Tragic 6.4% |
| Menominee | 0.0 /100 | #305 | Tragic 6.4% |
| Lumbee | 0.0 /100 | #306 | Tragic 6.4% |
| Immigrants | Bangladesh | 0.0 /100 | #307 | Tragic 6.5% |
| Barbadians | 0.0 /100 | #308 | Tragic 6.5% |
| Vietnamese | 0.0 /100 | #309 | Tragic 6.5% |
| Immigrants | Belize | 0.0 /100 | #310 | Tragic 6.5% |
| Cape Verdeans | 0.0 /100 | #311 | Tragic 6.5% |
| Colville | 0.0 /100 | #312 | Tragic 6.6% |
| Immigrants | Barbados | 0.0 /100 | #313 | Tragic 6.6% |
Demographics Similar to Immigrants from Korea by Unemployment
In terms of unemployment, the demographic groups most similar to Immigrants from Korea are Immigrants from Moldova (5.0%, a difference of 0.030%), Jordanian (5.0%, a difference of 0.090%), Immigrants from North Macedonia (5.0%, a difference of 0.13%), Immigrants from Sudan (5.0%, a difference of 0.14%), and Immigrants from South Africa (5.0%, a difference of 0.16%).
| Demographics | Rating | Rank | Unemployment |
| Basques | 97.6 /100 | #81 | Exceptional 5.0% |
| Fijians | 97.6 /100 | #82 | Exceptional 5.0% |
| Hmong | 97.6 /100 | #83 | Exceptional 5.0% |
| Russians | 97.4 /100 | #84 | Exceptional 5.0% |
| Immigrants | Australia | 97.0 /100 | #85 | Exceptional 5.0% |
| Hungarians | 96.9 /100 | #86 | Exceptional 5.0% |
| Immigrants | Moldova | 96.6 /100 | #87 | Exceptional 5.0% |
| Immigrants | Korea | 96.6 /100 | #88 | Exceptional 5.0% |
| Jordanians | 96.4 /100 | #89 | Exceptional 5.0% |
| Immigrants | North Macedonia | 96.3 /100 | #90 | Exceptional 5.0% |
| Immigrants | Sudan | 96.3 /100 | #91 | Exceptional 5.0% |
| Immigrants | South Africa | 96.2 /100 | #92 | Exceptional 5.0% |
| Ukrainians | 96.0 /100 | #93 | Exceptional 5.0% |
| Immigrants | Austria | 95.9 /100 | #94 | Exceptional 5.0% |
| Immigrants | Serbia | 95.6 /100 | #95 | Exceptional 5.0% |