Immigrants from Europe vs Immigrants from Korea Unemployment
COMPARE
Immigrants from Europe
Immigrants from Korea
Unemployment
Unemployment Comparison
Immigrants from Europe
Immigrants from Korea
5.1%
UNEMPLOYMENT
86.3/ 100
METRIC RATING
134th/ 347
METRIC RANK
5.0%
UNEMPLOYMENT
96.6/ 100
METRIC RATING
88th/ 347
METRIC RANK
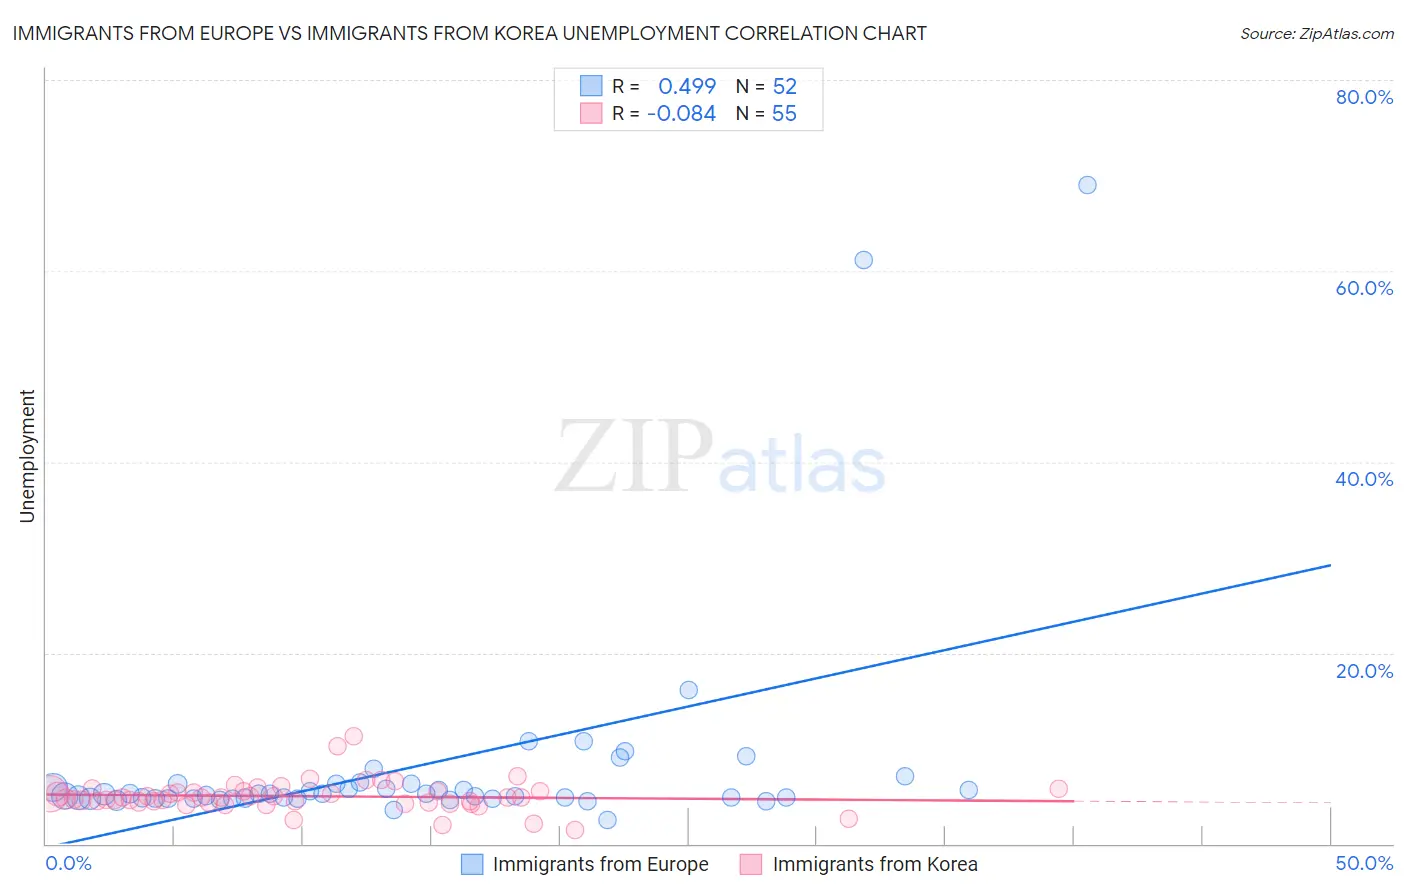
Immigrants from Europe vs Immigrants from Korea Unemployment Correlation Chart
The statistical analysis conducted on geographies consisting of 545,121,984 people shows a moderate positive correlation between the proportion of Immigrants from Europe and unemployment in the United States with a correlation coefficient (R) of 0.499 and weighted average of 5.1%. Similarly, the statistical analysis conducted on geographies consisting of 415,935,417 people shows a slight negative correlation between the proportion of Immigrants from Korea and unemployment in the United States with a correlation coefficient (R) of -0.084 and weighted average of 5.0%, a difference of 2.4%.
Unemployment Correlation Summary
| Measurement | Immigrants from Europe | Immigrants from Korea |
| Minimum | 2.5% | 1.5% |
| Maximum | 69.0% | 11.2% |
| Range | 66.5% | 9.7% |
| Mean | 8.1% | 5.0% |
| Median | 5.2% | 4.8% |
| Interquartile 25% (IQ1) | 4.7% | 4.3% |
| Interquartile 75% (IQ3) | 6.2% | 5.5% |
| Interquartile Range (IQR) | 1.5% | 1.2% |
| Standard Deviation (Sample) | 11.7% | 1.6% |
| Standard Deviation (Population) | 11.6% | 1.6% |
Similar Demographics by Unemployment
Demographics Similar to Immigrants from Europe by Unemployment
In terms of unemployment, the demographic groups most similar to Immigrants from Europe are Immigrants from Burma/Myanmar (5.1%, a difference of 0.010%), Immigrants from Spain (5.1%, a difference of 0.010%), Immigrants from Jordan (5.1%, a difference of 0.040%), Immigrants from Ethiopia (5.1%, a difference of 0.050%), and Immigrants from Croatia (5.1%, a difference of 0.060%).
| Demographics | Rating | Rank | Unemployment |
| Immigrants | Kenya | 88.2 /100 | #127 | Excellent 5.1% |
| Immigrants | Eastern Africa | 88.1 /100 | #128 | Excellent 5.1% |
| Immigrants | Latvia | 88.0 /100 | #129 | Excellent 5.1% |
| Iranians | 86.9 /100 | #130 | Excellent 5.1% |
| Immigrants | Croatia | 86.8 /100 | #131 | Excellent 5.1% |
| Immigrants | Ethiopia | 86.7 /100 | #132 | Excellent 5.1% |
| Immigrants | Jordan | 86.6 /100 | #133 | Excellent 5.1% |
| Immigrants | Europe | 86.3 /100 | #134 | Excellent 5.1% |
| Immigrants | Burma/Myanmar | 86.2 /100 | #135 | Excellent 5.1% |
| Immigrants | Spain | 86.2 /100 | #136 | Excellent 5.1% |
| Immigrants | Saudi Arabia | 85.6 /100 | #137 | Excellent 5.1% |
| Immigrants | Hungary | 85.6 /100 | #138 | Excellent 5.1% |
| Pakistanis | 85.3 /100 | #139 | Excellent 5.1% |
| Immigrants | Denmark | 84.3 /100 | #140 | Excellent 5.1% |
| Palestinians | 83.4 /100 | #141 | Excellent 5.1% |
Demographics Similar to Immigrants from Korea by Unemployment
In terms of unemployment, the demographic groups most similar to Immigrants from Korea are Immigrants from Moldova (5.0%, a difference of 0.030%), Jordanian (5.0%, a difference of 0.090%), Immigrants from North Macedonia (5.0%, a difference of 0.13%), Immigrants from Sudan (5.0%, a difference of 0.14%), and Immigrants from South Africa (5.0%, a difference of 0.16%).
| Demographics | Rating | Rank | Unemployment |
| Basques | 97.6 /100 | #81 | Exceptional 5.0% |
| Fijians | 97.6 /100 | #82 | Exceptional 5.0% |
| Hmong | 97.6 /100 | #83 | Exceptional 5.0% |
| Russians | 97.4 /100 | #84 | Exceptional 5.0% |
| Immigrants | Australia | 97.0 /100 | #85 | Exceptional 5.0% |
| Hungarians | 96.9 /100 | #86 | Exceptional 5.0% |
| Immigrants | Moldova | 96.6 /100 | #87 | Exceptional 5.0% |
| Immigrants | Korea | 96.6 /100 | #88 | Exceptional 5.0% |
| Jordanians | 96.4 /100 | #89 | Exceptional 5.0% |
| Immigrants | North Macedonia | 96.3 /100 | #90 | Exceptional 5.0% |
| Immigrants | Sudan | 96.3 /100 | #91 | Exceptional 5.0% |
| Immigrants | South Africa | 96.2 /100 | #92 | Exceptional 5.0% |
| Ukrainians | 96.0 /100 | #93 | Exceptional 5.0% |
| Immigrants | Austria | 95.9 /100 | #94 | Exceptional 5.0% |
| Immigrants | Serbia | 95.6 /100 | #95 | Exceptional 5.0% |