Immigrants from Afghanistan vs Immigrants from Korea Unemployment
COMPARE
Immigrants from Afghanistan
Immigrants from Korea
Unemployment
Unemployment Comparison
Immigrants from Afghanistan
Immigrants from Korea
5.3%
UNEMPLOYMENT
28.6/ 100
METRIC RATING
199th/ 347
METRIC RANK
5.0%
UNEMPLOYMENT
96.6/ 100
METRIC RATING
88th/ 347
METRIC RANK
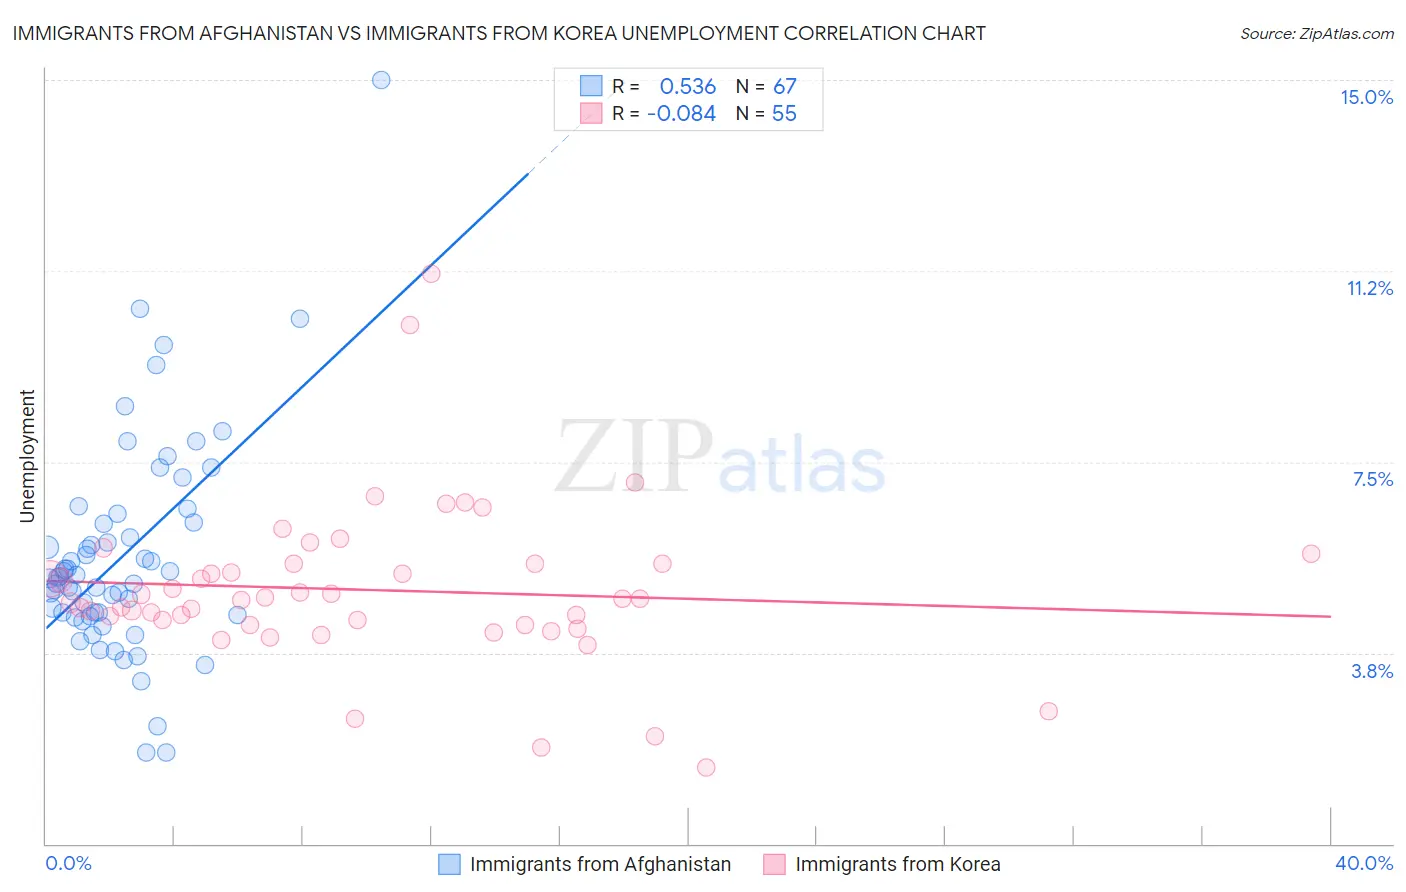
Immigrants from Afghanistan vs Immigrants from Korea Unemployment Correlation Chart
The statistical analysis conducted on geographies consisting of 147,628,423 people shows a substantial positive correlation between the proportion of Immigrants from Afghanistan and unemployment in the United States with a correlation coefficient (R) of 0.536 and weighted average of 5.3%. Similarly, the statistical analysis conducted on geographies consisting of 415,935,417 people shows a slight negative correlation between the proportion of Immigrants from Korea and unemployment in the United States with a correlation coefficient (R) of -0.084 and weighted average of 5.0%, a difference of 6.9%.
Unemployment Correlation Summary
| Measurement | Immigrants from Afghanistan | Immigrants from Korea |
| Minimum | 1.8% | 1.5% |
| Maximum | 15.0% | 11.2% |
| Range | 13.2% | 9.7% |
| Mean | 5.6% | 5.0% |
| Median | 5.2% | 4.8% |
| Interquartile 25% (IQ1) | 4.5% | 4.3% |
| Interquartile 75% (IQ3) | 6.3% | 5.5% |
| Interquartile Range (IQR) | 1.8% | 1.2% |
| Standard Deviation (Sample) | 2.1% | 1.6% |
| Standard Deviation (Population) | 2.1% | 1.6% |
Similar Demographics by Unemployment
Demographics Similar to Immigrants from Afghanistan by Unemployment
In terms of unemployment, the demographic groups most similar to Immigrants from Afghanistan are Immigrants from Israel (5.3%, a difference of 0.0%), Immigrants from Uruguay (5.3%, a difference of 0.090%), Korean (5.3%, a difference of 0.090%), Peruvian (5.3%, a difference of 0.10%), and Immigrants from South Eastern Asia (5.3%, a difference of 0.12%).
| Demographics | Rating | Rank | Unemployment |
| South Americans | 33.9 /100 | #192 | Fair 5.3% |
| Immigrants | Somalia | 33.8 /100 | #193 | Fair 5.3% |
| Immigrants | Laos | 30.9 /100 | #194 | Fair 5.3% |
| Immigrants | Southern Europe | 30.9 /100 | #195 | Fair 5.3% |
| Peruvians | 29.9 /100 | #196 | Fair 5.3% |
| Immigrants | Uruguay | 29.8 /100 | #197 | Fair 5.3% |
| Immigrants | Israel | 28.6 /100 | #198 | Fair 5.3% |
| Immigrants | Afghanistan | 28.6 /100 | #199 | Fair 5.3% |
| Koreans | 27.4 /100 | #200 | Fair 5.3% |
| Immigrants | South Eastern Asia | 27.0 /100 | #201 | Fair 5.3% |
| Cherokee | 25.5 /100 | #202 | Fair 5.3% |
| Immigrants | Micronesia | 25.2 /100 | #203 | Fair 5.3% |
| Immigrants | Ukraine | 24.9 /100 | #204 | Fair 5.3% |
| Native Hawaiians | 24.1 /100 | #205 | Fair 5.3% |
| Immigrants | Peru | 22.7 /100 | #206 | Fair 5.4% |
Demographics Similar to Immigrants from Korea by Unemployment
In terms of unemployment, the demographic groups most similar to Immigrants from Korea are Immigrants from Moldova (5.0%, a difference of 0.030%), Jordanian (5.0%, a difference of 0.090%), Immigrants from North Macedonia (5.0%, a difference of 0.13%), Immigrants from Sudan (5.0%, a difference of 0.14%), and Immigrants from South Africa (5.0%, a difference of 0.16%).
| Demographics | Rating | Rank | Unemployment |
| Basques | 97.6 /100 | #81 | Exceptional 5.0% |
| Fijians | 97.6 /100 | #82 | Exceptional 5.0% |
| Hmong | 97.6 /100 | #83 | Exceptional 5.0% |
| Russians | 97.4 /100 | #84 | Exceptional 5.0% |
| Immigrants | Australia | 97.0 /100 | #85 | Exceptional 5.0% |
| Hungarians | 96.9 /100 | #86 | Exceptional 5.0% |
| Immigrants | Moldova | 96.6 /100 | #87 | Exceptional 5.0% |
| Immigrants | Korea | 96.6 /100 | #88 | Exceptional 5.0% |
| Jordanians | 96.4 /100 | #89 | Exceptional 5.0% |
| Immigrants | North Macedonia | 96.3 /100 | #90 | Exceptional 5.0% |
| Immigrants | Sudan | 96.3 /100 | #91 | Exceptional 5.0% |
| Immigrants | South Africa | 96.2 /100 | #92 | Exceptional 5.0% |
| Ukrainians | 96.0 /100 | #93 | Exceptional 5.0% |
| Immigrants | Austria | 95.9 /100 | #94 | Exceptional 5.0% |
| Immigrants | Serbia | 95.6 /100 | #95 | Exceptional 5.0% |