Immigrants from South Eastern Asia vs Cuban Male Unemployment
COMPARE
Immigrants from South Eastern Asia
Cuban
Male Unemployment
Male Unemployment Comparison
Immigrants from South Eastern Asia
Cubans
5.4%
MALE UNEMPLOYMENT
28.2/ 100
METRIC RATING
191st/ 347
METRIC RANK
4.6%
MALE UNEMPLOYMENT
100.0/ 100
METRIC RATING
10th/ 347
METRIC RANK
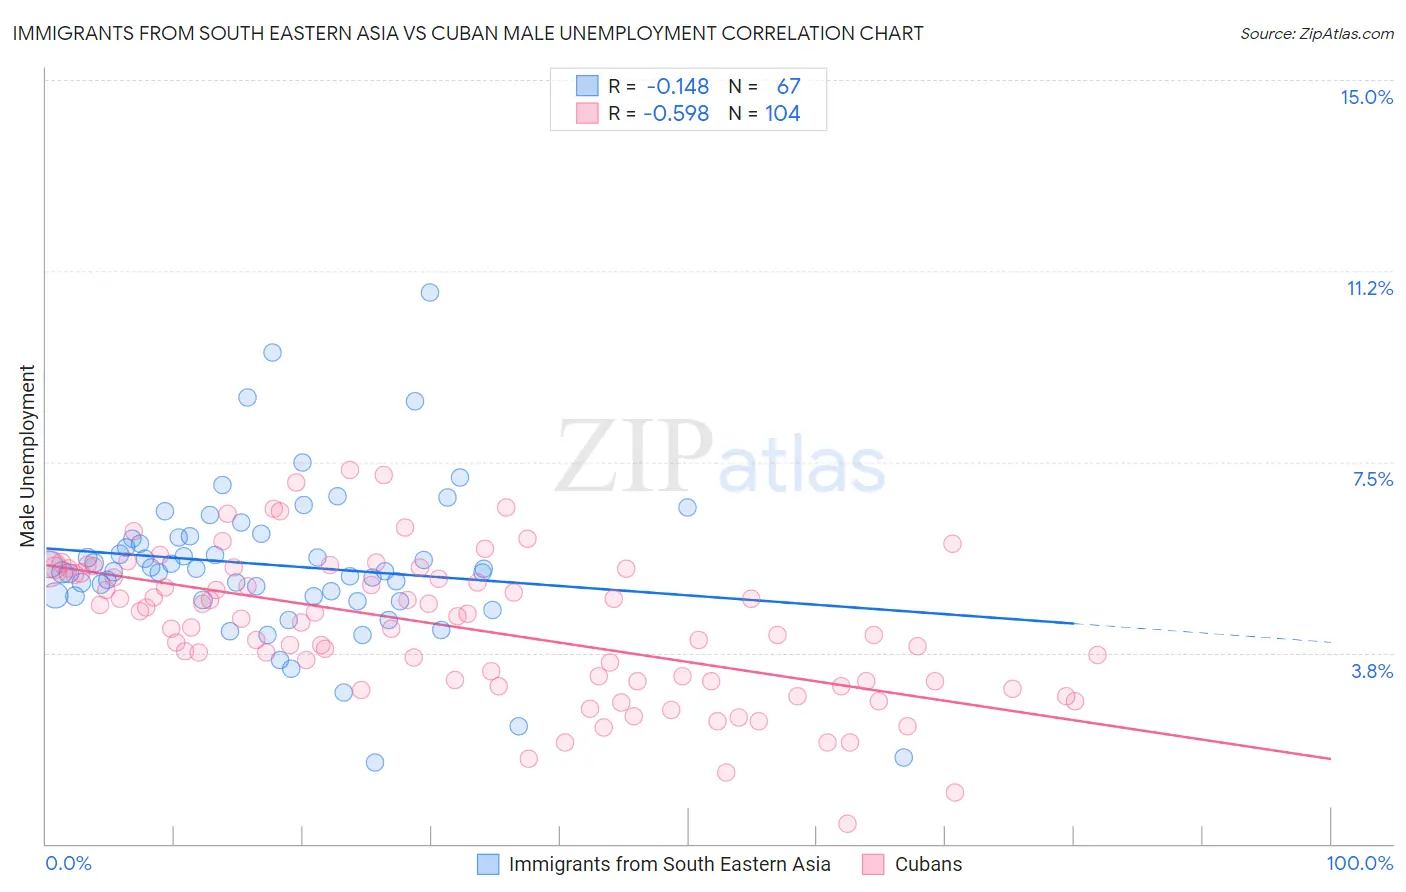
Immigrants from South Eastern Asia vs Cuban Male Unemployment Correlation Chart
The statistical analysis conducted on geographies consisting of 508,417,377 people shows a poor negative correlation between the proportion of Immigrants from South Eastern Asia and unemployment rate among males in the United States with a correlation coefficient (R) of -0.148 and weighted average of 5.4%. Similarly, the statistical analysis conducted on geographies consisting of 447,036,033 people shows a substantial negative correlation between the proportion of Cubans and unemployment rate among males in the United States with a correlation coefficient (R) of -0.598 and weighted average of 4.6%, a difference of 16.2%.
Male Unemployment Correlation Summary
| Measurement | Immigrants from South Eastern Asia | Cuban |
| Minimum | 1.6% | 0.40% |
| Maximum | 10.8% | 7.3% |
| Range | 9.2% | 6.9% |
| Mean | 5.5% | 4.3% |
| Median | 5.3% | 4.4% |
| Interquartile 25% (IQ1) | 4.9% | 3.2% |
| Interquartile 75% (IQ3) | 6.0% | 5.4% |
| Interquartile Range (IQR) | 1.2% | 2.2% |
| Standard Deviation (Sample) | 1.5% | 1.4% |
| Standard Deviation (Population) | 1.5% | 1.4% |
Similar Demographics by Male Unemployment
Demographics Similar to Immigrants from South Eastern Asia by Male Unemployment
In terms of male unemployment, the demographic groups most similar to Immigrants from South Eastern Asia are Immigrants from Uganda (5.4%, a difference of 0.040%), Immigrants from South America (5.4%, a difference of 0.080%), Arab (5.4%, a difference of 0.14%), Immigrants from Belarus (5.4%, a difference of 0.16%), and Costa Rican (5.4%, a difference of 0.21%).
| Demographics | Rating | Rank | Male Unemployment |
| Spaniards | 35.1 /100 | #184 | Fair 5.3% |
| Koreans | 34.9 /100 | #185 | Fair 5.3% |
| Iraqis | 31.6 /100 | #186 | Fair 5.4% |
| Costa Ricans | 31.3 /100 | #187 | Fair 5.4% |
| Arabs | 30.2 /100 | #188 | Fair 5.4% |
| Immigrants | South America | 29.4 /100 | #189 | Fair 5.4% |
| Immigrants | Uganda | 28.8 /100 | #190 | Fair 5.4% |
| Immigrants | South Eastern Asia | 28.2 /100 | #191 | Fair 5.4% |
| Immigrants | Belarus | 26.0 /100 | #192 | Fair 5.4% |
| Immigrants | Israel | 25.2 /100 | #193 | Fair 5.4% |
| Spanish | 19.7 /100 | #194 | Poor 5.4% |
| Immigrants | Southern Europe | 17.7 /100 | #195 | Poor 5.4% |
| Albanians | 17.3 /100 | #196 | Poor 5.4% |
| Alsatians | 16.7 /100 | #197 | Poor 5.4% |
| Immigrants | Thailand | 14.7 /100 | #198 | Poor 5.4% |
Demographics Similar to Cubans by Male Unemployment
In terms of male unemployment, the demographic groups most similar to Cubans are Swedish (4.6%, a difference of 0.20%), Thai (4.6%, a difference of 0.60%), Immigrants from Bolivia (4.7%, a difference of 0.93%), Bolivian (4.7%, a difference of 1.6%), and German (4.7%, a difference of 1.6%).
| Demographics | Rating | Rank | Male Unemployment |
| Norwegians | 100.0 /100 | #3 | Exceptional 4.4% |
| Immigrants | Venezuela | 100.0 /100 | #4 | Exceptional 4.4% |
| Danes | 100.0 /100 | #5 | Exceptional 4.5% |
| Venezuelans | 100.0 /100 | #6 | Exceptional 4.5% |
| Czechs | 100.0 /100 | #7 | Exceptional 4.5% |
| Luxembourgers | 100.0 /100 | #8 | Exceptional 4.5% |
| Thais | 100.0 /100 | #9 | Exceptional 4.6% |
| Cubans | 100.0 /100 | #10 | Exceptional 4.6% |
| Swedes | 100.0 /100 | #11 | Exceptional 4.6% |
| Immigrants | Bolivia | 100.0 /100 | #12 | Exceptional 4.7% |
| Bolivians | 100.0 /100 | #13 | Exceptional 4.7% |
| Germans | 100.0 /100 | #14 | Exceptional 4.7% |
| Scandinavians | 100.0 /100 | #15 | Exceptional 4.7% |
| Swiss | 99.9 /100 | #16 | Exceptional 4.7% |
| Filipinos | 99.9 /100 | #17 | Exceptional 4.7% |