Celtic vs Egyptian Male Unemployment
COMPARE
Celtic
Egyptian
Male Unemployment
Male Unemployment Comparison
Celtics
Egyptians
5.0%
MALE UNEMPLOYMENT
97.8/ 100
METRIC RATING
64th/ 347
METRIC RANK
5.2%
MALE UNEMPLOYMENT
74.8/ 100
METRIC RATING
152nd/ 347
METRIC RANK
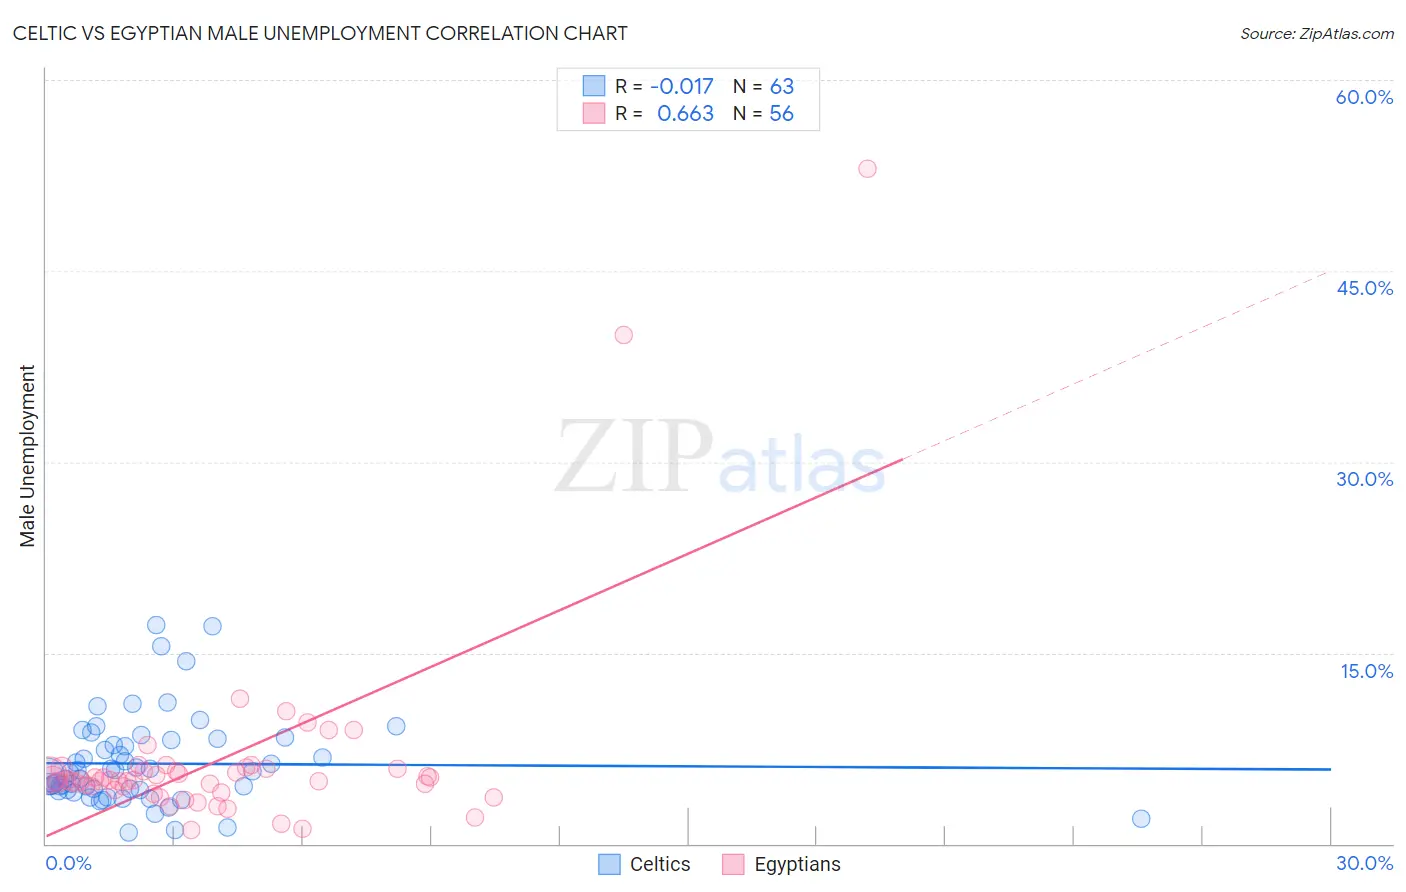
Celtic vs Egyptian Male Unemployment Correlation Chart
The statistical analysis conducted on geographies consisting of 168,462,496 people shows no correlation between the proportion of Celtics and unemployment rate among males in the United States with a correlation coefficient (R) of -0.017 and weighted average of 5.0%. Similarly, the statistical analysis conducted on geographies consisting of 276,492,252 people shows a significant positive correlation between the proportion of Egyptians and unemployment rate among males in the United States with a correlation coefficient (R) of 0.663 and weighted average of 5.2%, a difference of 4.2%.
Male Unemployment Correlation Summary
| Measurement | Celtic | Egyptian |
| Minimum | 0.90% | 1.1% |
| Maximum | 17.2% | 53.0% |
| Range | 16.3% | 51.9% |
| Mean | 6.3% | 6.6% |
| Median | 5.6% | 5.0% |
| Interquartile 25% (IQ1) | 4.2% | 4.4% |
| Interquartile 75% (IQ3) | 8.2% | 5.9% |
| Interquartile Range (IQR) | 4.0% | 1.5% |
| Standard Deviation (Sample) | 3.5% | 8.1% |
| Standard Deviation (Population) | 3.5% | 8.0% |
Similar Demographics by Male Unemployment
Demographics Similar to Celtics by Male Unemployment
In terms of male unemployment, the demographic groups most similar to Celtics are Eastern European (5.0%, a difference of 0.020%), Basque (5.0%, a difference of 0.030%), Cambodian (5.0%, a difference of 0.16%), Icelander (5.0%, a difference of 0.16%), and Immigrants from Argentina (5.0%, a difference of 0.24%).
| Demographics | Rating | Rank | Male Unemployment |
| Turks | 98.5 /100 | #57 | Exceptional 5.0% |
| Lithuanians | 98.5 /100 | #58 | Exceptional 5.0% |
| Immigrants | Netherlands | 98.3 /100 | #59 | Exceptional 5.0% |
| Immigrants | Argentina | 98.1 /100 | #60 | Exceptional 5.0% |
| Cambodians | 98.1 /100 | #61 | Exceptional 5.0% |
| Basques | 97.9 /100 | #62 | Exceptional 5.0% |
| Eastern Europeans | 97.9 /100 | #63 | Exceptional 5.0% |
| Celtics | 97.8 /100 | #64 | Exceptional 5.0% |
| Icelanders | 97.6 /100 | #65 | Exceptional 5.0% |
| Finns | 97.5 /100 | #66 | Exceptional 5.0% |
| Immigrants | Canada | 97.5 /100 | #67 | Exceptional 5.0% |
| Australians | 97.4 /100 | #68 | Exceptional 5.0% |
| Immigrants | Sweden | 97.4 /100 | #69 | Exceptional 5.0% |
| Whites/Caucasians | 97.3 /100 | #70 | Exceptional 5.0% |
| New Zealanders | 97.3 /100 | #71 | Exceptional 5.0% |
Demographics Similar to Egyptians by Male Unemployment
In terms of male unemployment, the demographic groups most similar to Egyptians are Slovak (5.2%, a difference of 0.050%), Immigrants from Uruguay (5.2%, a difference of 0.070%), Laotian (5.2%, a difference of 0.080%), Indian (Asian) (5.2%, a difference of 0.090%), and Immigrants from Europe (5.2%, a difference of 0.11%).
| Demographics | Rating | Rank | Male Unemployment |
| Macedonians | 77.7 /100 | #145 | Good 5.2% |
| Immigrants | Kenya | 77.6 /100 | #146 | Good 5.2% |
| Immigrants | Burma/Myanmar | 77.5 /100 | #147 | Good 5.2% |
| Immigrants | Italy | 76.3 /100 | #148 | Good 5.2% |
| Immigrants | Europe | 76.2 /100 | #149 | Good 5.2% |
| Indians (Asian) | 76.0 /100 | #150 | Good 5.2% |
| Slovaks | 75.5 /100 | #151 | Good 5.2% |
| Egyptians | 74.8 /100 | #152 | Good 5.2% |
| Immigrants | Uruguay | 73.9 /100 | #153 | Good 5.2% |
| Laotians | 73.8 /100 | #154 | Good 5.2% |
| Immigrants | Hungary | 73.4 /100 | #155 | Good 5.2% |
| Americans | 72.7 /100 | #156 | Good 5.2% |
| Immigrants | Northern Africa | 72.3 /100 | #157 | Good 5.2% |
| Immigrants | Indonesia | 71.5 /100 | #158 | Good 5.2% |
| Indonesians | 71.2 /100 | #159 | Good 5.2% |