Celtic vs Immigrants from Latin America Male Unemployment
COMPARE
Celtic
Immigrants from Latin America
Male Unemployment
Male Unemployment Comparison
Celtics
Immigrants from Latin America
5.0%
MALE UNEMPLOYMENT
97.8/ 100
METRIC RATING
64th/ 347
METRIC RANK
5.9%
MALE UNEMPLOYMENT
0.1/ 100
METRIC RATING
263rd/ 347
METRIC RANK
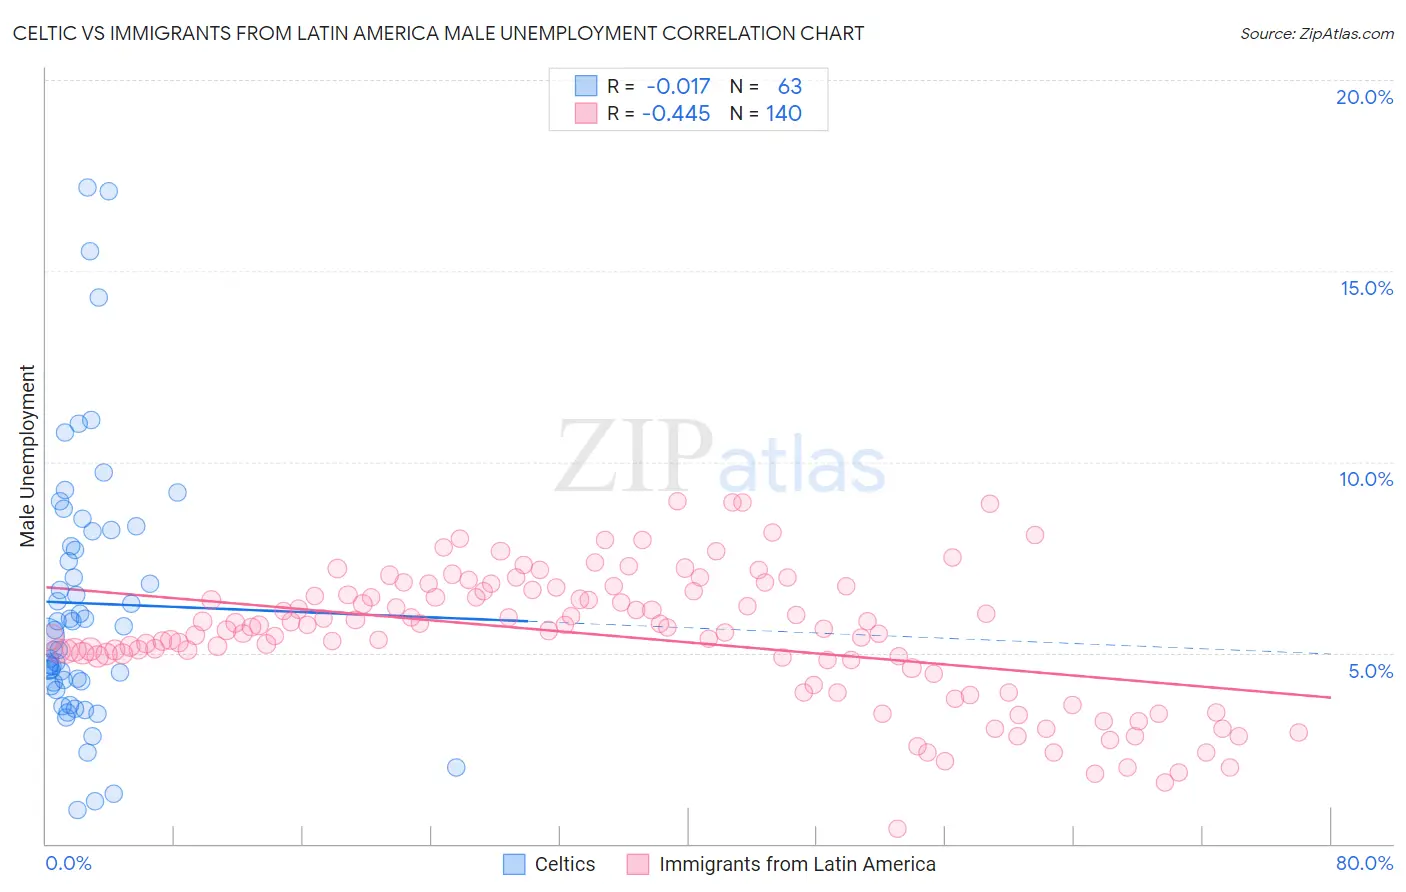
Celtic vs Immigrants from Latin America Male Unemployment Correlation Chart
The statistical analysis conducted on geographies consisting of 168,462,496 people shows no correlation between the proportion of Celtics and unemployment rate among males in the United States with a correlation coefficient (R) of -0.017 and weighted average of 5.0%. Similarly, the statistical analysis conducted on geographies consisting of 550,432,007 people shows a moderate negative correlation between the proportion of Immigrants from Latin America and unemployment rate among males in the United States with a correlation coefficient (R) of -0.445 and weighted average of 5.9%, a difference of 17.5%.
Male Unemployment Correlation Summary
| Measurement | Celtic | Immigrants from Latin America |
| Minimum | 0.90% | 0.40% |
| Maximum | 17.2% | 9.0% |
| Range | 16.3% | 8.6% |
| Mean | 6.3% | 5.4% |
| Median | 5.6% | 5.6% |
| Interquartile 25% (IQ1) | 4.2% | 4.8% |
| Interquartile 75% (IQ3) | 8.2% | 6.6% |
| Interquartile Range (IQR) | 4.0% | 1.8% |
| Standard Deviation (Sample) | 3.5% | 1.7% |
| Standard Deviation (Population) | 3.5% | 1.7% |
Similar Demographics by Male Unemployment
Demographics Similar to Celtics by Male Unemployment
In terms of male unemployment, the demographic groups most similar to Celtics are Eastern European (5.0%, a difference of 0.020%), Basque (5.0%, a difference of 0.030%), Cambodian (5.0%, a difference of 0.16%), Icelander (5.0%, a difference of 0.16%), and Immigrants from Argentina (5.0%, a difference of 0.24%).
| Demographics | Rating | Rank | Male Unemployment |
| Turks | 98.5 /100 | #57 | Exceptional 5.0% |
| Lithuanians | 98.5 /100 | #58 | Exceptional 5.0% |
| Immigrants | Netherlands | 98.3 /100 | #59 | Exceptional 5.0% |
| Immigrants | Argentina | 98.1 /100 | #60 | Exceptional 5.0% |
| Cambodians | 98.1 /100 | #61 | Exceptional 5.0% |
| Basques | 97.9 /100 | #62 | Exceptional 5.0% |
| Eastern Europeans | 97.9 /100 | #63 | Exceptional 5.0% |
| Celtics | 97.8 /100 | #64 | Exceptional 5.0% |
| Icelanders | 97.6 /100 | #65 | Exceptional 5.0% |
| Finns | 97.5 /100 | #66 | Exceptional 5.0% |
| Immigrants | Canada | 97.5 /100 | #67 | Exceptional 5.0% |
| Australians | 97.4 /100 | #68 | Exceptional 5.0% |
| Immigrants | Sweden | 97.4 /100 | #69 | Exceptional 5.0% |
| Whites/Caucasians | 97.3 /100 | #70 | Exceptional 5.0% |
| New Zealanders | 97.3 /100 | #71 | Exceptional 5.0% |
Demographics Similar to Immigrants from Latin America by Male Unemployment
In terms of male unemployment, the demographic groups most similar to Immigrants from Latin America are Immigrants from Mexico (5.9%, a difference of 0.22%), Immigrants from Portugal (5.9%, a difference of 0.24%), French American Indian (5.9%, a difference of 0.61%), Liberian (5.8%, a difference of 0.69%), and Bahamian (5.9%, a difference of 0.75%).
| Demographics | Rating | Rank | Male Unemployment |
| Comanche | 0.2 /100 | #256 | Tragic 5.8% |
| Hispanics or Latinos | 0.1 /100 | #257 | Tragic 5.8% |
| Dutch West Indians | 0.1 /100 | #258 | Tragic 5.8% |
| Cajuns | 0.1 /100 | #259 | Tragic 5.8% |
| Immigrants | Central America | 0.1 /100 | #260 | Tragic 5.8% |
| Liberians | 0.1 /100 | #261 | Tragic 5.8% |
| Immigrants | Portugal | 0.1 /100 | #262 | Tragic 5.9% |
| Immigrants | Latin America | 0.1 /100 | #263 | Tragic 5.9% |
| Immigrants | Mexico | 0.0 /100 | #264 | Tragic 5.9% |
| French American Indians | 0.0 /100 | #265 | Tragic 5.9% |
| Bahamians | 0.0 /100 | #266 | Tragic 5.9% |
| Nigerians | 0.0 /100 | #267 | Tragic 5.9% |
| Bermudans | 0.0 /100 | #268 | Tragic 5.9% |
| Immigrants | Nigeria | 0.0 /100 | #269 | Tragic 6.0% |
| Sub-Saharan Africans | 0.0 /100 | #270 | Tragic 6.0% |