Celtic vs Tohono O'odham Male Unemployment
COMPARE
Celtic
Tohono O'odham
Male Unemployment
Male Unemployment Comparison
Celtics
Tohono O'odham
5.0%
MALE UNEMPLOYMENT
97.8/ 100
METRIC RATING
64th/ 347
METRIC RANK
10.2%
MALE UNEMPLOYMENT
0.0/ 100
METRIC RATING
342nd/ 347
METRIC RANK
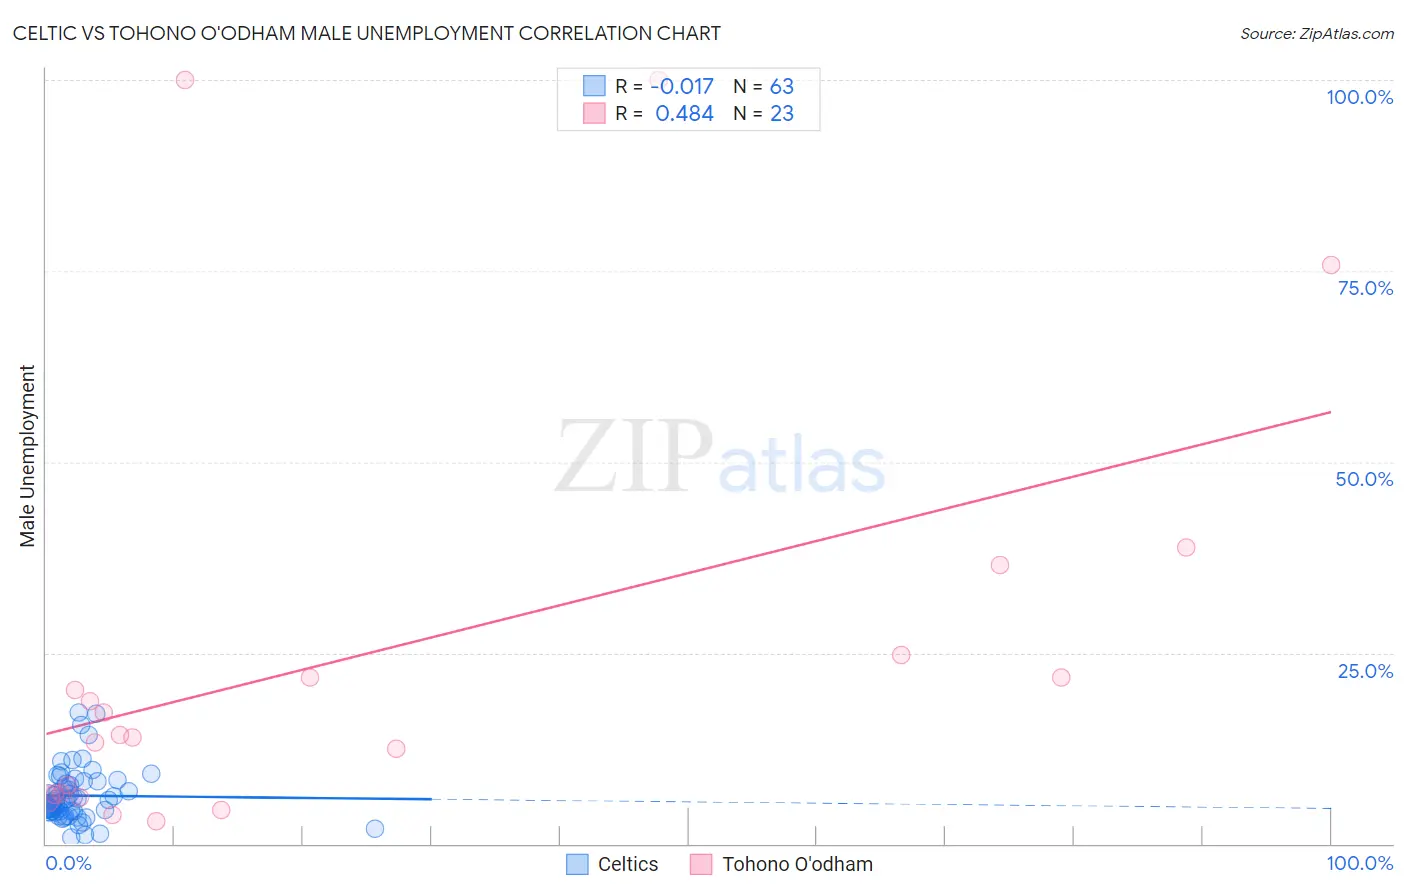
Celtic vs Tohono O'odham Male Unemployment Correlation Chart
The statistical analysis conducted on geographies consisting of 168,462,496 people shows no correlation between the proportion of Celtics and unemployment rate among males in the United States with a correlation coefficient (R) of -0.017 and weighted average of 5.0%. Similarly, the statistical analysis conducted on geographies consisting of 58,664,487 people shows a moderate positive correlation between the proportion of Tohono O'odham and unemployment rate among males in the United States with a correlation coefficient (R) of 0.484 and weighted average of 10.2%, a difference of 103.3%.
Male Unemployment Correlation Summary
| Measurement | Celtic | Tohono O'odham |
| Minimum | 0.90% | 2.9% |
| Maximum | 17.2% | 100.0% |
| Range | 16.3% | 97.1% |
| Mean | 6.3% | 24.9% |
| Median | 5.6% | 14.2% |
| Interquartile 25% (IQ1) | 4.2% | 6.5% |
| Interquartile 75% (IQ3) | 8.2% | 24.7% |
| Interquartile Range (IQR) | 4.0% | 18.2% |
| Standard Deviation (Sample) | 3.5% | 28.5% |
| Standard Deviation (Population) | 3.5% | 27.9% |
Similar Demographics by Male Unemployment
Demographics Similar to Celtics by Male Unemployment
In terms of male unemployment, the demographic groups most similar to Celtics are Eastern European (5.0%, a difference of 0.020%), Basque (5.0%, a difference of 0.030%), Cambodian (5.0%, a difference of 0.16%), Icelander (5.0%, a difference of 0.16%), and Immigrants from Argentina (5.0%, a difference of 0.24%).
| Demographics | Rating | Rank | Male Unemployment |
| Turks | 98.5 /100 | #57 | Exceptional 5.0% |
| Lithuanians | 98.5 /100 | #58 | Exceptional 5.0% |
| Immigrants | Netherlands | 98.3 /100 | #59 | Exceptional 5.0% |
| Immigrants | Argentina | 98.1 /100 | #60 | Exceptional 5.0% |
| Cambodians | 98.1 /100 | #61 | Exceptional 5.0% |
| Basques | 97.9 /100 | #62 | Exceptional 5.0% |
| Eastern Europeans | 97.9 /100 | #63 | Exceptional 5.0% |
| Celtics | 97.8 /100 | #64 | Exceptional 5.0% |
| Icelanders | 97.6 /100 | #65 | Exceptional 5.0% |
| Finns | 97.5 /100 | #66 | Exceptional 5.0% |
| Immigrants | Canada | 97.5 /100 | #67 | Exceptional 5.0% |
| Australians | 97.4 /100 | #68 | Exceptional 5.0% |
| Immigrants | Sweden | 97.4 /100 | #69 | Exceptional 5.0% |
| Whites/Caucasians | 97.3 /100 | #70 | Exceptional 5.0% |
| New Zealanders | 97.3 /100 | #71 | Exceptional 5.0% |
Demographics Similar to Tohono O'odham by Male Unemployment
In terms of male unemployment, the demographic groups most similar to Tohono O'odham are Navajo (9.8%, a difference of 3.4%), Alaskan Athabascan (9.8%, a difference of 3.7%), Cheyenne (9.8%, a difference of 3.8%), Crow (10.6%, a difference of 4.4%), and Hopi (10.8%, a difference of 6.1%).
| Demographics | Rating | Rank | Male Unemployment |
| Sioux | 0.0 /100 | #333 | Tragic 8.4% |
| Tsimshian | 0.0 /100 | #334 | Tragic 8.5% |
| Pueblo | 0.0 /100 | #335 | Tragic 8.5% |
| Yuman | 0.0 /100 | #336 | Tragic 8.6% |
| Puerto Ricans | 0.0 /100 | #337 | Tragic 8.6% |
| Apache | 0.0 /100 | #338 | Tragic 8.6% |
| Cheyenne | 0.0 /100 | #339 | Tragic 9.8% |
| Alaskan Athabascans | 0.0 /100 | #340 | Tragic 9.8% |
| Navajo | 0.0 /100 | #341 | Tragic 9.8% |
| Tohono O'odham | 0.0 /100 | #342 | Tragic 10.2% |
| Crow | 0.0 /100 | #343 | Tragic 10.6% |
| Hopi | 0.0 /100 | #344 | Tragic 10.8% |
| Arapaho | 0.0 /100 | #345 | Tragic 11.0% |
| Inupiat | 0.0 /100 | #346 | Tragic 12.1% |
| Yup'ik | 0.0 /100 | #347 | Tragic 16.4% |