Celtic vs Paiute Male Unemployment
COMPARE
Celtic
Paiute
Male Unemployment
Male Unemployment Comparison
Celtics
Paiute
5.0%
MALE UNEMPLOYMENT
97.8/ 100
METRIC RATING
64th/ 347
METRIC RANK
7.7%
MALE UNEMPLOYMENT
0.0/ 100
METRIC RATING
327th/ 347
METRIC RANK
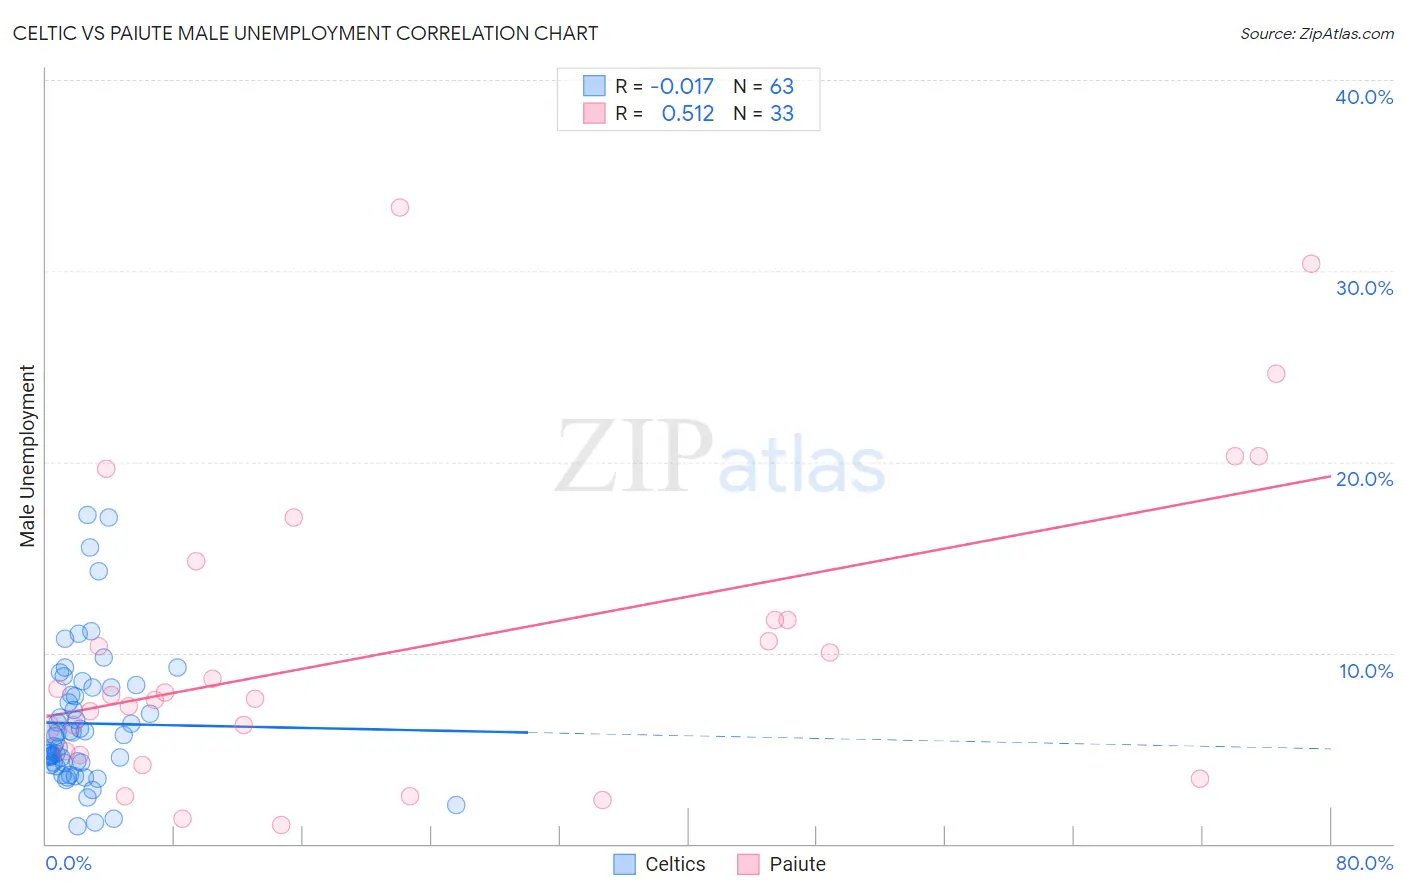
Celtic vs Paiute Male Unemployment Correlation Chart
The statistical analysis conducted on geographies consisting of 168,462,496 people shows no correlation between the proportion of Celtics and unemployment rate among males in the United States with a correlation coefficient (R) of -0.017 and weighted average of 5.0%. Similarly, the statistical analysis conducted on geographies consisting of 58,346,230 people shows a substantial positive correlation between the proportion of Paiute and unemployment rate among males in the United States with a correlation coefficient (R) of 0.512 and weighted average of 7.7%, a difference of 53.8%.
Male Unemployment Correlation Summary
| Measurement | Celtic | Paiute |
| Minimum | 0.90% | 1.0% |
| Maximum | 17.2% | 33.3% |
| Range | 16.3% | 32.3% |
| Mean | 6.3% | 10.4% |
| Median | 5.6% | 7.8% |
| Interquartile 25% (IQ1) | 4.2% | 4.8% |
| Interquartile 75% (IQ3) | 8.2% | 13.3% |
| Interquartile Range (IQR) | 4.0% | 8.5% |
| Standard Deviation (Sample) | 3.5% | 8.1% |
| Standard Deviation (Population) | 3.5% | 8.0% |
Similar Demographics by Male Unemployment
Demographics Similar to Celtics by Male Unemployment
In terms of male unemployment, the demographic groups most similar to Celtics are Eastern European (5.0%, a difference of 0.020%), Basque (5.0%, a difference of 0.030%), Cambodian (5.0%, a difference of 0.16%), Icelander (5.0%, a difference of 0.16%), and Immigrants from Argentina (5.0%, a difference of 0.24%).
| Demographics | Rating | Rank | Male Unemployment |
| Turks | 98.5 /100 | #57 | Exceptional 5.0% |
| Lithuanians | 98.5 /100 | #58 | Exceptional 5.0% |
| Immigrants | Netherlands | 98.3 /100 | #59 | Exceptional 5.0% |
| Immigrants | Argentina | 98.1 /100 | #60 | Exceptional 5.0% |
| Cambodians | 98.1 /100 | #61 | Exceptional 5.0% |
| Basques | 97.9 /100 | #62 | Exceptional 5.0% |
| Eastern Europeans | 97.9 /100 | #63 | Exceptional 5.0% |
| Celtics | 97.8 /100 | #64 | Exceptional 5.0% |
| Icelanders | 97.6 /100 | #65 | Exceptional 5.0% |
| Finns | 97.5 /100 | #66 | Exceptional 5.0% |
| Immigrants | Canada | 97.5 /100 | #67 | Exceptional 5.0% |
| Australians | 97.4 /100 | #68 | Exceptional 5.0% |
| Immigrants | Sweden | 97.4 /100 | #69 | Exceptional 5.0% |
| Whites/Caucasians | 97.3 /100 | #70 | Exceptional 5.0% |
| New Zealanders | 97.3 /100 | #71 | Exceptional 5.0% |
Demographics Similar to Paiute by Male Unemployment
In terms of male unemployment, the demographic groups most similar to Paiute are Native/Alaskan (7.7%, a difference of 0.38%), Immigrants from Dominican Republic (7.6%, a difference of 1.1%), Shoshone (7.6%, a difference of 1.2%), Immigrants from Yemen (7.8%, a difference of 1.3%), and Dominican (7.6%, a difference of 1.6%).
| Demographics | Rating | Rank | Male Unemployment |
| Colville | 0.0 /100 | #320 | Tragic 7.4% |
| Immigrants | St. Vincent and the Grenadines | 0.0 /100 | #321 | Tragic 7.5% |
| Immigrants | Cabo Verde | 0.0 /100 | #322 | Tragic 7.5% |
| Immigrants | Grenada | 0.0 /100 | #323 | Tragic 7.6% |
| Dominicans | 0.0 /100 | #324 | Tragic 7.6% |
| Shoshone | 0.0 /100 | #325 | Tragic 7.6% |
| Immigrants | Dominican Republic | 0.0 /100 | #326 | Tragic 7.6% |
| Paiute | 0.0 /100 | #327 | Tragic 7.7% |
| Natives/Alaskans | 0.0 /100 | #328 | Tragic 7.7% |
| Immigrants | Yemen | 0.0 /100 | #329 | Tragic 7.8% |
| Yakama | 0.0 /100 | #330 | Tragic 7.9% |
| Alaska Natives | 0.0 /100 | #331 | Tragic 8.1% |
| Pima | 0.0 /100 | #332 | Tragic 8.3% |
| Sioux | 0.0 /100 | #333 | Tragic 8.4% |
| Tsimshian | 0.0 /100 | #334 | Tragic 8.5% |