Immigrants vs Immigrants from Netherlands Female Unemployment
COMPARE
Immigrants
Immigrants from Netherlands
Female Unemployment
Female Unemployment Comparison
Immigrants
Immigrants from Netherlands
5.7%
FEMALE UNEMPLOYMENT
0.6/ 100
METRIC RATING
254th/ 347
METRIC RANK
5.0%
FEMALE UNEMPLOYMENT
97.8/ 100
METRIC RATING
78th/ 347
METRIC RANK
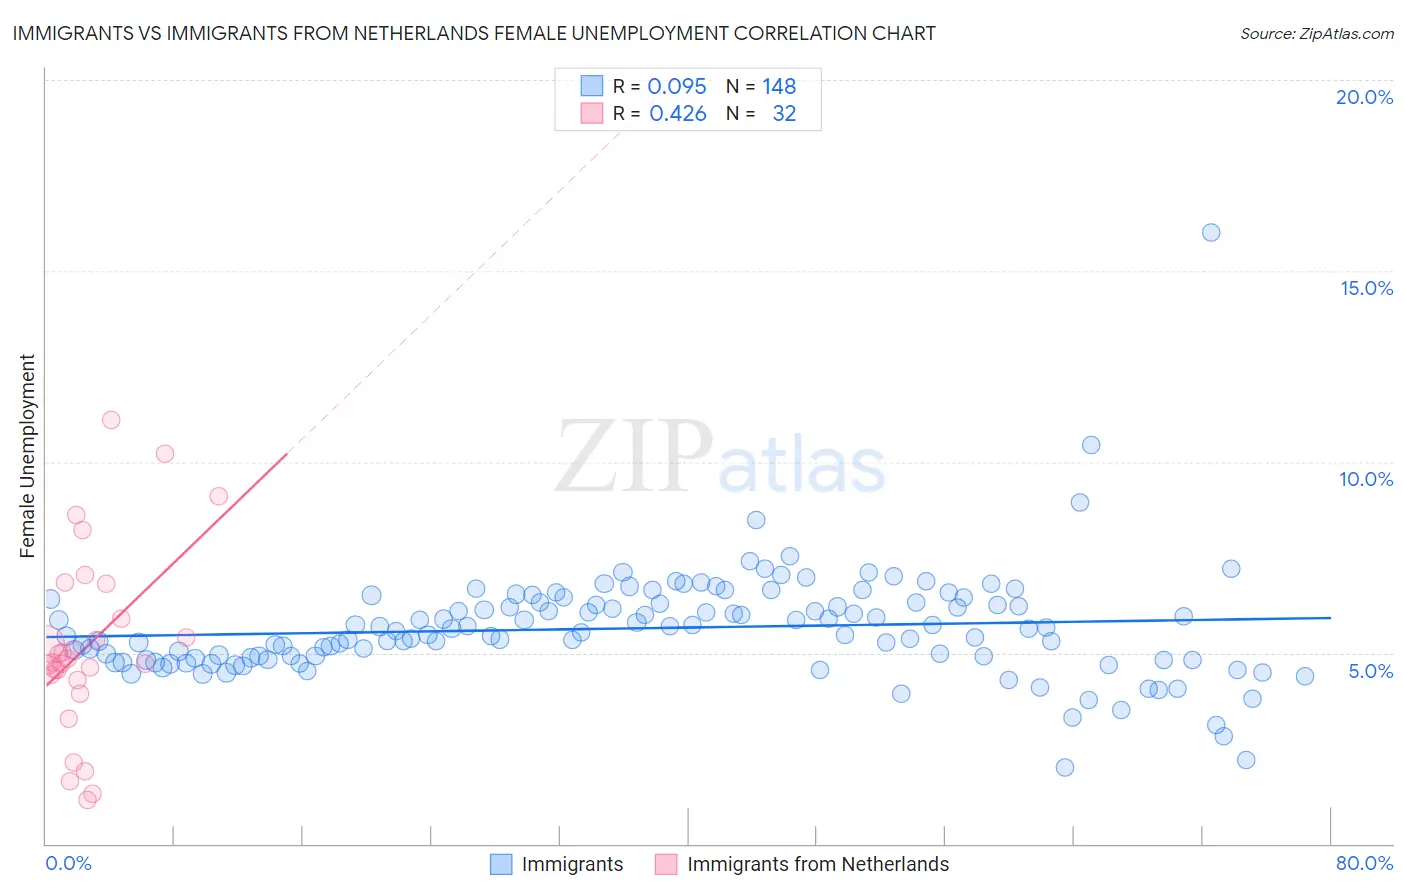
Immigrants vs Immigrants from Netherlands Female Unemployment Correlation Chart
The statistical analysis conducted on geographies consisting of 563,480,166 people shows a slight positive correlation between the proportion of Immigrants and unemploymnet rate among females in the United States with a correlation coefficient (R) of 0.095 and weighted average of 5.7%. Similarly, the statistical analysis conducted on geographies consisting of 237,125,714 people shows a moderate positive correlation between the proportion of Immigrants from Netherlands and unemploymnet rate among females in the United States with a correlation coefficient (R) of 0.426 and weighted average of 5.0%, a difference of 14.2%.
Female Unemployment Correlation Summary
| Measurement | Immigrants | Immigrants from Netherlands |
| Minimum | 2.0% | 1.2% |
| Maximum | 16.0% | 11.1% |
| Range | 14.0% | 9.9% |
| Mean | 5.6% | 5.2% |
| Median | 5.5% | 4.8% |
| Interquartile 25% (IQ1) | 4.8% | 4.4% |
| Interquartile 75% (IQ3) | 6.3% | 6.4% |
| Interquartile Range (IQR) | 1.4% | 2.0% |
| Standard Deviation (Sample) | 1.4% | 2.4% |
| Standard Deviation (Population) | 1.4% | 2.4% |
Similar Demographics by Female Unemployment
Demographics Similar to Immigrants by Female Unemployment
In terms of female unemployment, the demographic groups most similar to Immigrants are Immigrants from Sierra Leone (5.7%, a difference of 0.0%), Immigrants from Cameroon (5.7%, a difference of 0.040%), Cajun (5.7%, a difference of 0.15%), Assyrian/Chaldean/Syriac (5.6%, a difference of 0.34%), and Immigrants from Syria (5.6%, a difference of 0.41%).
| Demographics | Rating | Rank | Female Unemployment |
| Immigrants | Western Asia | 1.1 /100 | #247 | Tragic 5.6% |
| Cree | 1.0 /100 | #248 | Tragic 5.6% |
| Immigrants | Uzbekistan | 1.0 /100 | #249 | Tragic 5.6% |
| Immigrants | Syria | 0.8 /100 | #250 | Tragic 5.6% |
| Assyrians/Chaldeans/Syriacs | 0.8 /100 | #251 | Tragic 5.6% |
| Cajuns | 0.7 /100 | #252 | Tragic 5.7% |
| Immigrants | Sierra Leone | 0.6 /100 | #253 | Tragic 5.7% |
| Immigrants | Immigrants | 0.6 /100 | #254 | Tragic 5.7% |
| Immigrants | Cameroon | 0.6 /100 | #255 | Tragic 5.7% |
| Sub-Saharan Africans | 0.4 /100 | #256 | Tragic 5.7% |
| Dutch West Indians | 0.3 /100 | #257 | Tragic 5.7% |
| Immigrants | Portugal | 0.2 /100 | #258 | Tragic 5.8% |
| Immigrants | Fiji | 0.2 /100 | #259 | Tragic 5.8% |
| Nigerians | 0.2 /100 | #260 | Tragic 5.8% |
| Kiowa | 0.1 /100 | #261 | Tragic 5.8% |
Demographics Similar to Immigrants from Netherlands by Female Unemployment
In terms of female unemployment, the demographic groups most similar to Immigrants from Netherlands are Mongolian (5.0%, a difference of 0.0%), Immigrants from Venezuela (5.0%, a difference of 0.090%), Immigrants from Singapore (5.0%, a difference of 0.10%), Immigrants from Bolivia (5.0%, a difference of 0.12%), and Russian (5.0%, a difference of 0.13%).
| Demographics | Rating | Rank | Female Unemployment |
| German Russians | 98.1 /100 | #71 | Exceptional 4.9% |
| Immigrants | Northern Europe | 98.0 /100 | #72 | Exceptional 4.9% |
| Russians | 98.0 /100 | #73 | Exceptional 5.0% |
| Immigrants | Bolivia | 98.0 /100 | #74 | Exceptional 5.0% |
| Immigrants | Singapore | 98.0 /100 | #75 | Exceptional 5.0% |
| Immigrants | Venezuela | 97.9 /100 | #76 | Exceptional 5.0% |
| Mongolians | 97.8 /100 | #77 | Exceptional 5.0% |
| Immigrants | Netherlands | 97.8 /100 | #78 | Exceptional 5.0% |
| Turks | 97.6 /100 | #79 | Exceptional 5.0% |
| New Zealanders | 97.4 /100 | #80 | Exceptional 5.0% |
| Filipinos | 97.3 /100 | #81 | Exceptional 5.0% |
| Immigrants | Australia | 97.3 /100 | #82 | Exceptional 5.0% |
| Immigrants | Serbia | 97.2 /100 | #83 | Exceptional 5.0% |
| Canadians | 97.2 /100 | #84 | Exceptional 5.0% |
| Ukrainians | 97.1 /100 | #85 | Exceptional 5.0% |