Russian vs Immigrants from Netherlands Female Unemployment
COMPARE
Russian
Immigrants from Netherlands
Female Unemployment
Female Unemployment Comparison
Russians
Immigrants from Netherlands
5.0%
FEMALE UNEMPLOYMENT
98.0/ 100
METRIC RATING
73rd/ 347
METRIC RANK
5.0%
FEMALE UNEMPLOYMENT
97.8/ 100
METRIC RATING
78th/ 347
METRIC RANK
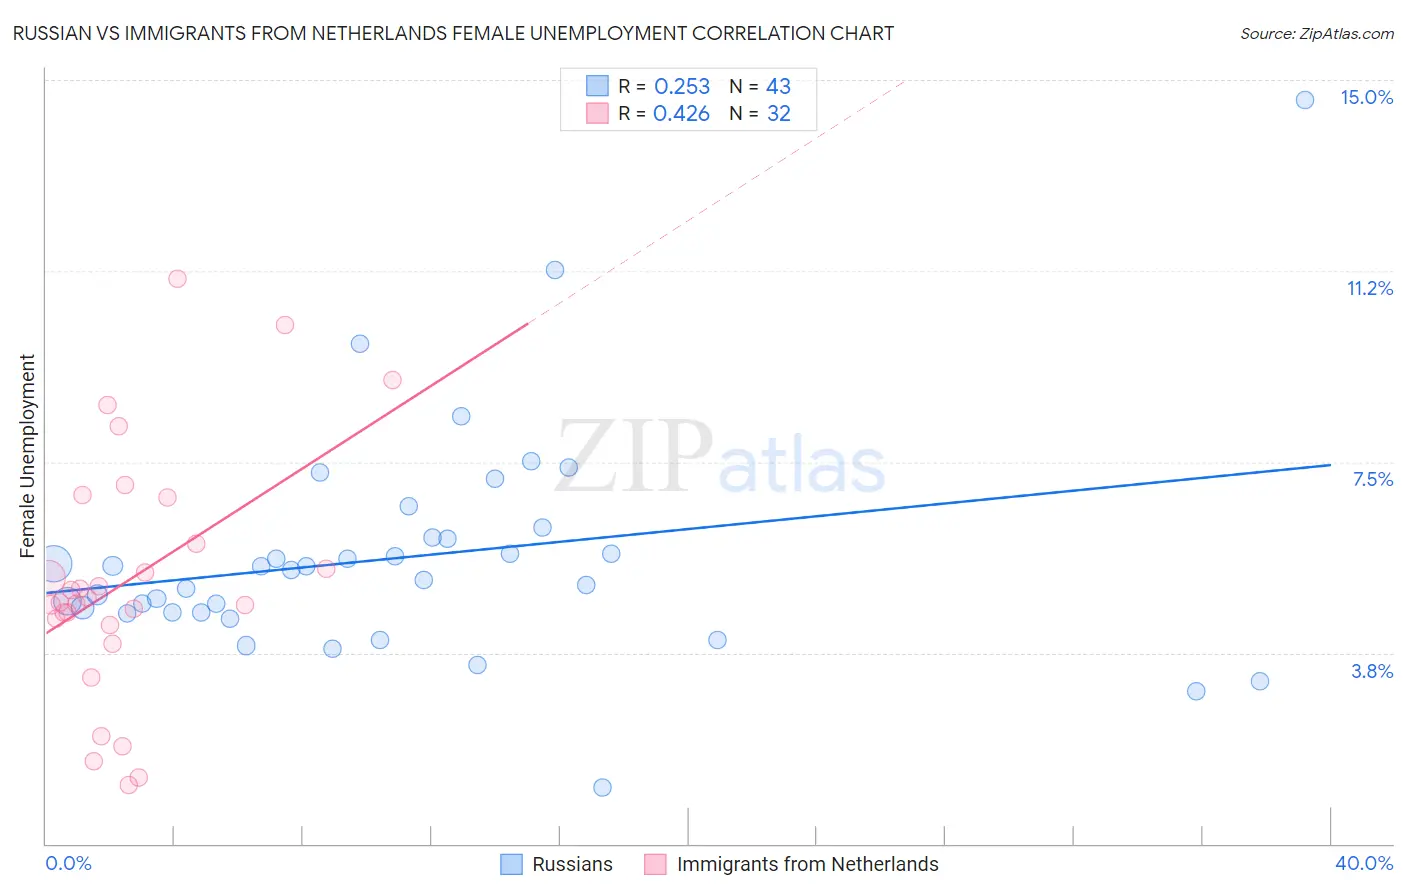
Russian vs Immigrants from Netherlands Female Unemployment Correlation Chart
The statistical analysis conducted on geographies consisting of 505,214,756 people shows a weak positive correlation between the proportion of Russians and unemploymnet rate among females in the United States with a correlation coefficient (R) of 0.253 and weighted average of 5.0%. Similarly, the statistical analysis conducted on geographies consisting of 237,125,714 people shows a moderate positive correlation between the proportion of Immigrants from Netherlands and unemploymnet rate among females in the United States with a correlation coefficient (R) of 0.426 and weighted average of 5.0%, a difference of 0.13%.
Female Unemployment Correlation Summary
| Measurement | Russian | Immigrants from Netherlands |
| Minimum | 1.1% | 1.2% |
| Maximum | 14.6% | 11.1% |
| Range | 13.5% | 9.9% |
| Mean | 5.6% | 5.2% |
| Median | 5.4% | 4.8% |
| Interquartile 25% (IQ1) | 4.5% | 4.4% |
| Interquartile 75% (IQ3) | 6.0% | 6.4% |
| Interquartile Range (IQR) | 1.5% | 2.0% |
| Standard Deviation (Sample) | 2.2% | 2.4% |
| Standard Deviation (Population) | 2.2% | 2.4% |
Demographics Similar to Russians and Immigrants from Netherlands by Female Unemployment
In terms of female unemployment, the demographic groups most similar to Russians are Immigrants from Bolivia (5.0%, a difference of 0.010%), Immigrants from Northern Europe (4.9%, a difference of 0.030%), Immigrants from Singapore (5.0%, a difference of 0.030%), Immigrants from Venezuela (5.0%, a difference of 0.040%), and German Russian (4.9%, a difference of 0.10%). Similarly, the demographic groups most similar to Immigrants from Netherlands are Mongolian (5.0%, a difference of 0.0%), Immigrants from Venezuela (5.0%, a difference of 0.090%), Immigrants from Singapore (5.0%, a difference of 0.10%), Immigrants from Bolivia (5.0%, a difference of 0.12%), and Immigrants from Northern Europe (4.9%, a difference of 0.16%).
| Demographics | Rating | Rank | Female Unemployment |
| Immigrants | North America | 98.3 /100 | #65 | Exceptional 4.9% |
| Hungarians | 98.3 /100 | #66 | Exceptional 4.9% |
| Cubans | 98.3 /100 | #67 | Exceptional 4.9% |
| Tlingit-Haida | 98.3 /100 | #68 | Exceptional 4.9% |
| Immigrants | Ireland | 98.2 /100 | #69 | Exceptional 4.9% |
| Osage | 98.2 /100 | #70 | Exceptional 4.9% |
| German Russians | 98.1 /100 | #71 | Exceptional 4.9% |
| Immigrants | Northern Europe | 98.0 /100 | #72 | Exceptional 4.9% |
| Russians | 98.0 /100 | #73 | Exceptional 5.0% |
| Immigrants | Bolivia | 98.0 /100 | #74 | Exceptional 5.0% |
| Immigrants | Singapore | 98.0 /100 | #75 | Exceptional 5.0% |
| Immigrants | Venezuela | 97.9 /100 | #76 | Exceptional 5.0% |
| Mongolians | 97.8 /100 | #77 | Exceptional 5.0% |
| Immigrants | Netherlands | 97.8 /100 | #78 | Exceptional 5.0% |
| Turks | 97.6 /100 | #79 | Exceptional 5.0% |
| New Zealanders | 97.4 /100 | #80 | Exceptional 5.0% |
| Filipinos | 97.3 /100 | #81 | Exceptional 5.0% |
| Immigrants | Australia | 97.3 /100 | #82 | Exceptional 5.0% |
| Immigrants | Serbia | 97.2 /100 | #83 | Exceptional 5.0% |
| Canadians | 97.2 /100 | #84 | Exceptional 5.0% |
| Ukrainians | 97.1 /100 | #85 | Exceptional 5.0% |