Ethiopian vs Immigrants from Netherlands Female Unemployment
COMPARE
Ethiopian
Immigrants from Netherlands
Female Unemployment
Female Unemployment Comparison
Ethiopians
Immigrants from Netherlands
5.1%
FEMALE UNEMPLOYMENT
85.7/ 100
METRIC RATING
129th/ 347
METRIC RANK
5.0%
FEMALE UNEMPLOYMENT
97.8/ 100
METRIC RATING
78th/ 347
METRIC RANK
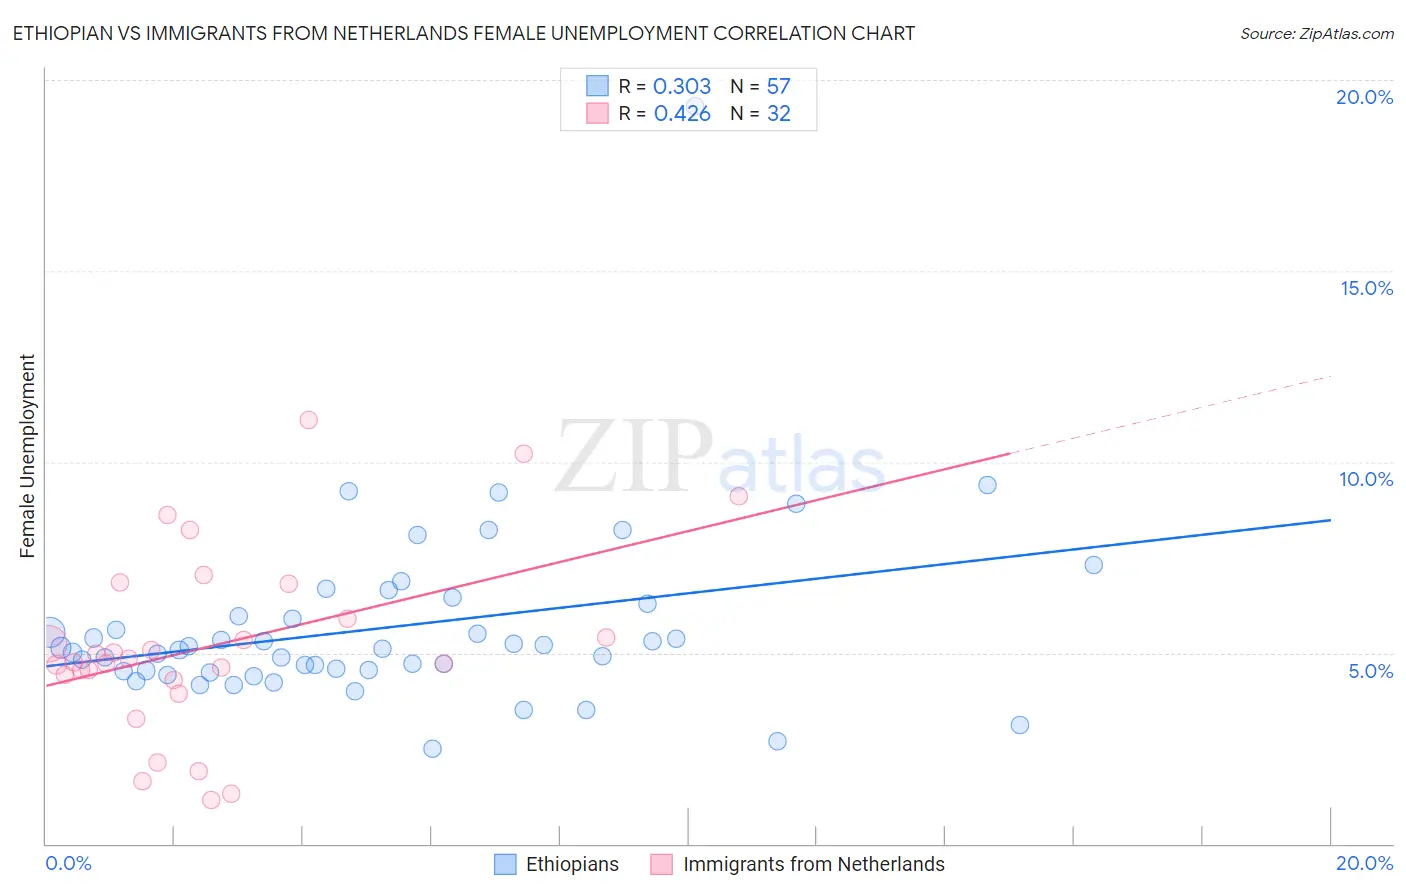
Ethiopian vs Immigrants from Netherlands Female Unemployment Correlation Chart
The statistical analysis conducted on geographies consisting of 222,927,979 people shows a mild positive correlation between the proportion of Ethiopians and unemploymnet rate among females in the United States with a correlation coefficient (R) of 0.303 and weighted average of 5.1%. Similarly, the statistical analysis conducted on geographies consisting of 237,125,714 people shows a moderate positive correlation between the proportion of Immigrants from Netherlands and unemploymnet rate among females in the United States with a correlation coefficient (R) of 0.426 and weighted average of 5.0%, a difference of 3.2%.
Female Unemployment Correlation Summary
| Measurement | Ethiopian | Immigrants from Netherlands |
| Minimum | 2.5% | 1.2% |
| Maximum | 19.3% | 11.1% |
| Range | 16.8% | 9.9% |
| Mean | 5.7% | 5.2% |
| Median | 5.1% | 4.8% |
| Interquartile 25% (IQ1) | 4.5% | 4.4% |
| Interquartile 75% (IQ3) | 6.1% | 6.4% |
| Interquartile Range (IQR) | 1.6% | 2.0% |
| Standard Deviation (Sample) | 2.4% | 2.4% |
| Standard Deviation (Population) | 2.4% | 2.4% |
Similar Demographics by Female Unemployment
Demographics Similar to Ethiopians by Female Unemployment
In terms of female unemployment, the demographic groups most similar to Ethiopians are Chilean (5.1%, a difference of 0.010%), Maltese (5.1%, a difference of 0.030%), Immigrants from Hungary (5.1%, a difference of 0.040%), Immigrants from Ethiopia (5.1%, a difference of 0.050%), and Immigrants from Korea (5.1%, a difference of 0.080%).
| Demographics | Rating | Rank | Female Unemployment |
| Immigrants | Germany | 87.6 /100 | #122 | Excellent 5.1% |
| Immigrants | South Africa | 87.6 /100 | #123 | Excellent 5.1% |
| Immigrants | Europe | 87.2 /100 | #124 | Excellent 5.1% |
| Basques | 86.5 /100 | #125 | Excellent 5.1% |
| Immigrants | Korea | 86.3 /100 | #126 | Excellent 5.1% |
| Immigrants | Hungary | 86.0 /100 | #127 | Excellent 5.1% |
| Chileans | 85.8 /100 | #128 | Excellent 5.1% |
| Ethiopians | 85.7 /100 | #129 | Excellent 5.1% |
| Maltese | 85.5 /100 | #130 | Excellent 5.1% |
| Immigrants | Ethiopia | 85.4 /100 | #131 | Excellent 5.1% |
| Immigrants | Sri Lanka | 85.0 /100 | #132 | Excellent 5.1% |
| Immigrants | Hong Kong | 84.8 /100 | #133 | Excellent 5.1% |
| Immigrants | Eritrea | 84.6 /100 | #134 | Excellent 5.1% |
| Immigrants | Latvia | 84.6 /100 | #135 | Excellent 5.1% |
| Indians (Asian) | 84.2 /100 | #136 | Excellent 5.1% |
Demographics Similar to Immigrants from Netherlands by Female Unemployment
In terms of female unemployment, the demographic groups most similar to Immigrants from Netherlands are Mongolian (5.0%, a difference of 0.0%), Immigrants from Venezuela (5.0%, a difference of 0.090%), Immigrants from Singapore (5.0%, a difference of 0.10%), Immigrants from Bolivia (5.0%, a difference of 0.12%), and Russian (5.0%, a difference of 0.13%).
| Demographics | Rating | Rank | Female Unemployment |
| German Russians | 98.1 /100 | #71 | Exceptional 4.9% |
| Immigrants | Northern Europe | 98.0 /100 | #72 | Exceptional 4.9% |
| Russians | 98.0 /100 | #73 | Exceptional 5.0% |
| Immigrants | Bolivia | 98.0 /100 | #74 | Exceptional 5.0% |
| Immigrants | Singapore | 98.0 /100 | #75 | Exceptional 5.0% |
| Immigrants | Venezuela | 97.9 /100 | #76 | Exceptional 5.0% |
| Mongolians | 97.8 /100 | #77 | Exceptional 5.0% |
| Immigrants | Netherlands | 97.8 /100 | #78 | Exceptional 5.0% |
| Turks | 97.6 /100 | #79 | Exceptional 5.0% |
| New Zealanders | 97.4 /100 | #80 | Exceptional 5.0% |
| Filipinos | 97.3 /100 | #81 | Exceptional 5.0% |
| Immigrants | Australia | 97.3 /100 | #82 | Exceptional 5.0% |
| Immigrants | Serbia | 97.2 /100 | #83 | Exceptional 5.0% |
| Canadians | 97.2 /100 | #84 | Exceptional 5.0% |
| Ukrainians | 97.1 /100 | #85 | Exceptional 5.0% |