Bulgarian vs Nicaraguan Female Unemployment
COMPARE
Bulgarian
Nicaraguan
Female Unemployment
Female Unemployment Comparison
Bulgarians
Nicaraguans
4.7%
FEMALE UNEMPLOYMENT
99.9/ 100
METRIC RATING
20th/ 347
METRIC RANK
5.5%
FEMALE UNEMPLOYMENT
7.2/ 100
METRIC RATING
222nd/ 347
METRIC RANK
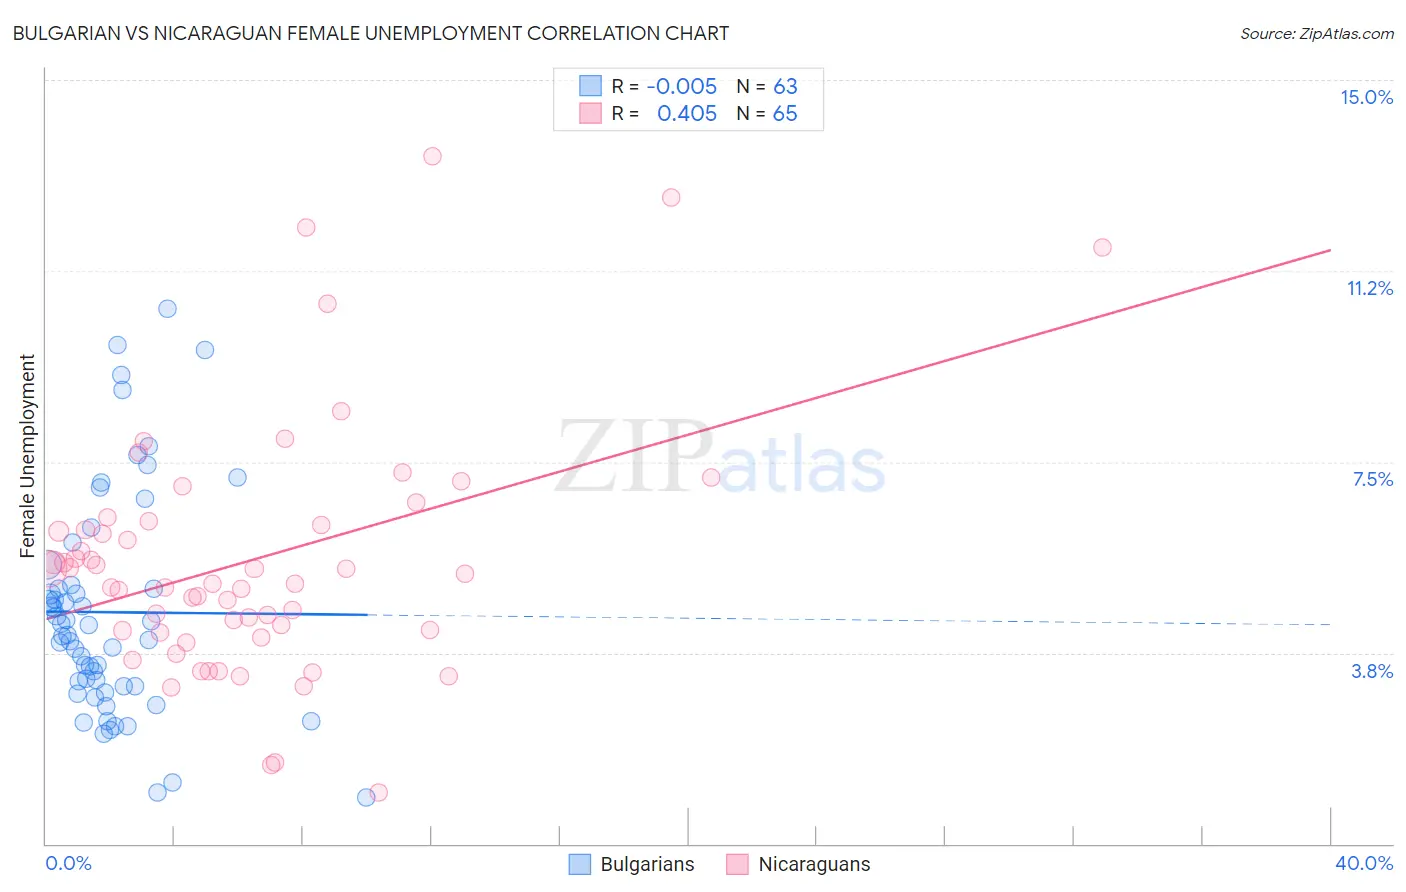
Bulgarian vs Nicaraguan Female Unemployment Correlation Chart
The statistical analysis conducted on geographies consisting of 205,222,328 people shows no correlation between the proportion of Bulgarians and unemploymnet rate among females in the United States with a correlation coefficient (R) of -0.005 and weighted average of 4.7%. Similarly, the statistical analysis conducted on geographies consisting of 285,135,127 people shows a moderate positive correlation between the proportion of Nicaraguans and unemploymnet rate among females in the United States with a correlation coefficient (R) of 0.405 and weighted average of 5.5%, a difference of 16.5%.
Female Unemployment Correlation Summary
| Measurement | Bulgarian | Nicaraguan |
| Minimum | 0.90% | 1.0% |
| Maximum | 10.5% | 13.5% |
| Range | 9.6% | 12.5% |
| Mean | 4.5% | 5.6% |
| Median | 4.1% | 5.1% |
| Interquartile 25% (IQ1) | 3.1% | 4.2% |
| Interquartile 75% (IQ3) | 5.1% | 6.3% |
| Interquartile Range (IQR) | 2.0% | 2.1% |
| Standard Deviation (Sample) | 2.2% | 2.4% |
| Standard Deviation (Population) | 2.2% | 2.4% |
Similar Demographics by Female Unemployment
Demographics Similar to Bulgarians by Female Unemployment
In terms of female unemployment, the demographic groups most similar to Bulgarians are Fijian (4.7%, a difference of 0.010%), European (4.7%, a difference of 0.030%), Polish (4.7%, a difference of 0.080%), Latvian (4.7%, a difference of 0.090%), and Croatian (4.7%, a difference of 0.24%).
| Demographics | Rating | Rank | Female Unemployment |
| Belgians | 100.0 /100 | #13 | Exceptional 4.6% |
| Finns | 100.0 /100 | #14 | Exceptional 4.6% |
| English | 100.0 /100 | #15 | Exceptional 4.6% |
| Carpatho Rusyns | 99.9 /100 | #16 | Exceptional 4.7% |
| Croatians | 99.9 /100 | #17 | Exceptional 4.7% |
| Latvians | 99.9 /100 | #18 | Exceptional 4.7% |
| Poles | 99.9 /100 | #19 | Exceptional 4.7% |
| Bulgarians | 99.9 /100 | #20 | Exceptional 4.7% |
| Fijians | 99.9 /100 | #21 | Exceptional 4.7% |
| Europeans | 99.9 /100 | #22 | Exceptional 4.7% |
| Scottish | 99.9 /100 | #23 | Exceptional 4.7% |
| Welsh | 99.9 /100 | #24 | Exceptional 4.7% |
| Immigrants | India | 99.9 /100 | #25 | Exceptional 4.7% |
| Immigrants | Bosnia and Herzegovina | 99.9 /100 | #26 | Exceptional 4.7% |
| British | 99.9 /100 | #27 | Exceptional 4.7% |
Demographics Similar to Nicaraguans by Female Unemployment
In terms of female unemployment, the demographic groups most similar to Nicaraguans are Delaware (5.5%, a difference of 0.010%), Brazilian (5.5%, a difference of 0.020%), Iraqi (5.5%, a difference of 0.040%), Immigrants from Africa (5.4%, a difference of 0.26%), and South American (5.4%, a difference of 0.27%).
| Demographics | Rating | Rank | Female Unemployment |
| Immigrants | Nicaragua | 10.2 /100 | #215 | Poor 5.4% |
| Comanche | 10.0 /100 | #216 | Poor 5.4% |
| Peruvians | 9.6 /100 | #217 | Tragic 5.4% |
| Bermudans | 9.0 /100 | #218 | Tragic 5.4% |
| South Americans | 8.6 /100 | #219 | Tragic 5.4% |
| Immigrants | Africa | 8.5 /100 | #220 | Tragic 5.4% |
| Brazilians | 7.3 /100 | #221 | Tragic 5.5% |
| Nicaraguans | 7.2 /100 | #222 | Tragic 5.5% |
| Delaware | 7.2 /100 | #223 | Tragic 5.5% |
| Iraqis | 7.1 /100 | #224 | Tragic 5.5% |
| French American Indians | 6.1 /100 | #225 | Tragic 5.5% |
| Immigrants | Peru | 5.9 /100 | #226 | Tragic 5.5% |
| Immigrants | Philippines | 5.3 /100 | #227 | Tragic 5.5% |
| Israelis | 4.8 /100 | #228 | Tragic 5.5% |
| Panamanians | 4.7 /100 | #229 | Tragic 5.5% |