Bulgarian vs Hungarian Female Unemployment
COMPARE
Bulgarian
Hungarian
Female Unemployment
Female Unemployment Comparison
Bulgarians
Hungarians
4.7%
FEMALE UNEMPLOYMENT
99.9/ 100
METRIC RATING
20th/ 347
METRIC RANK
4.9%
FEMALE UNEMPLOYMENT
98.3/ 100
METRIC RATING
66th/ 347
METRIC RANK
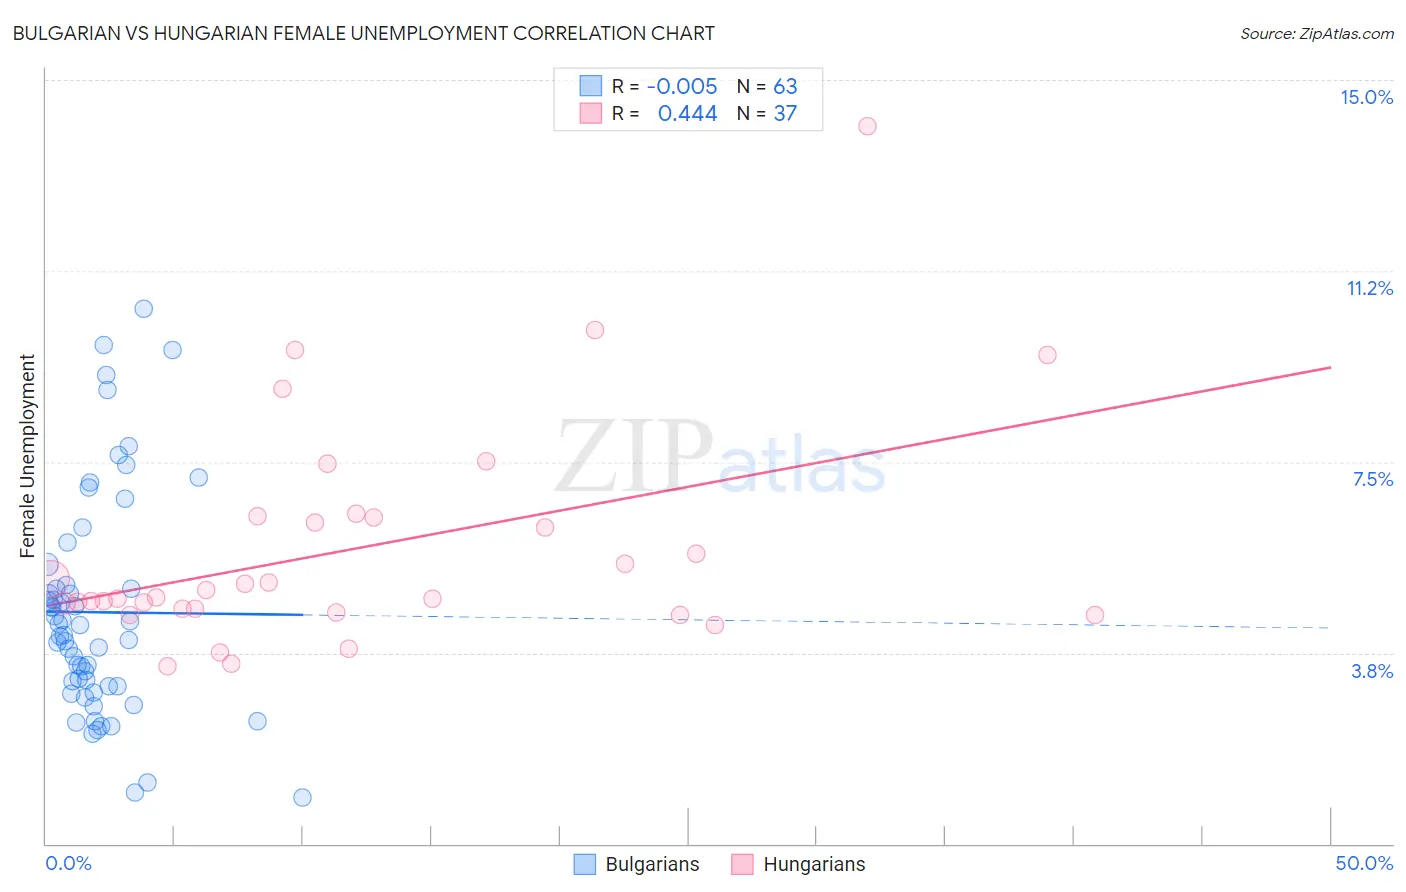
Bulgarian vs Hungarian Female Unemployment Correlation Chart
The statistical analysis conducted on geographies consisting of 205,222,328 people shows no correlation between the proportion of Bulgarians and unemploymnet rate among females in the United States with a correlation coefficient (R) of -0.005 and weighted average of 4.7%. Similarly, the statistical analysis conducted on geographies consisting of 480,650,444 people shows a moderate positive correlation between the proportion of Hungarians and unemploymnet rate among females in the United States with a correlation coefficient (R) of 0.444 and weighted average of 4.9%, a difference of 5.4%.
Female Unemployment Correlation Summary
| Measurement | Bulgarian | Hungarian |
| Minimum | 0.90% | 3.5% |
| Maximum | 10.5% | 14.1% |
| Range | 9.6% | 10.6% |
| Mean | 4.5% | 5.8% |
| Median | 4.1% | 4.8% |
| Interquartile 25% (IQ1) | 3.1% | 4.6% |
| Interquartile 75% (IQ3) | 5.1% | 6.4% |
| Interquartile Range (IQR) | 2.0% | 1.9% |
| Standard Deviation (Sample) | 2.2% | 2.2% |
| Standard Deviation (Population) | 2.2% | 2.2% |
Similar Demographics by Female Unemployment
Demographics Similar to Bulgarians by Female Unemployment
In terms of female unemployment, the demographic groups most similar to Bulgarians are Fijian (4.7%, a difference of 0.010%), European (4.7%, a difference of 0.030%), Polish (4.7%, a difference of 0.080%), Latvian (4.7%, a difference of 0.090%), and Croatian (4.7%, a difference of 0.24%).
| Demographics | Rating | Rank | Female Unemployment |
| Belgians | 100.0 /100 | #13 | Exceptional 4.6% |
| Finns | 100.0 /100 | #14 | Exceptional 4.6% |
| English | 100.0 /100 | #15 | Exceptional 4.6% |
| Carpatho Rusyns | 99.9 /100 | #16 | Exceptional 4.7% |
| Croatians | 99.9 /100 | #17 | Exceptional 4.7% |
| Latvians | 99.9 /100 | #18 | Exceptional 4.7% |
| Poles | 99.9 /100 | #19 | Exceptional 4.7% |
| Bulgarians | 99.9 /100 | #20 | Exceptional 4.7% |
| Fijians | 99.9 /100 | #21 | Exceptional 4.7% |
| Europeans | 99.9 /100 | #22 | Exceptional 4.7% |
| Scottish | 99.9 /100 | #23 | Exceptional 4.7% |
| Welsh | 99.9 /100 | #24 | Exceptional 4.7% |
| Immigrants | India | 99.9 /100 | #25 | Exceptional 4.7% |
| Immigrants | Bosnia and Herzegovina | 99.9 /100 | #26 | Exceptional 4.7% |
| British | 99.9 /100 | #27 | Exceptional 4.7% |
Demographics Similar to Hungarians by Female Unemployment
In terms of female unemployment, the demographic groups most similar to Hungarians are Cuban (4.9%, a difference of 0.0%), Tlingit-Haida (4.9%, a difference of 0.010%), Immigrants from Ireland (4.9%, a difference of 0.020%), Immigrants from North America (4.9%, a difference of 0.030%), and Osage (4.9%, a difference of 0.060%).
| Demographics | Rating | Rank | Female Unemployment |
| Bhutanese | 98.7 /100 | #59 | Exceptional 4.9% |
| Immigrants | Scotland | 98.6 /100 | #60 | Exceptional 4.9% |
| Immigrants | Canada | 98.6 /100 | #61 | Exceptional 4.9% |
| Immigrants | Nepal | 98.6 /100 | #62 | Exceptional 4.9% |
| Immigrants | Belgium | 98.5 /100 | #63 | Exceptional 4.9% |
| Celtics | 98.5 /100 | #64 | Exceptional 4.9% |
| Immigrants | North America | 98.3 /100 | #65 | Exceptional 4.9% |
| Hungarians | 98.3 /100 | #66 | Exceptional 4.9% |
| Cubans | 98.3 /100 | #67 | Exceptional 4.9% |
| Tlingit-Haida | 98.3 /100 | #68 | Exceptional 4.9% |
| Immigrants | Ireland | 98.2 /100 | #69 | Exceptional 4.9% |
| Osage | 98.2 /100 | #70 | Exceptional 4.9% |
| German Russians | 98.1 /100 | #71 | Exceptional 4.9% |
| Immigrants | Northern Europe | 98.0 /100 | #72 | Exceptional 4.9% |
| Russians | 98.0 /100 | #73 | Exceptional 5.0% |