Bulgarian vs Chickasaw Unemployment Among Women with Children Ages 6 to 17 years
COMPARE
Bulgarian
Chickasaw
Unemployment Among Women with Children Ages 6 to 17 years
Unemployment Among Women with Children Ages 6 to 17 years Comparison
Bulgarians
Chickasaw
8.4%
UNEMPLOYMENT AMONG WOMEN WITH CHILDREN AGES 6 TO 17 YEARS
99.5/ 100
METRIC RATING
83rd/ 347
METRIC RANK
8.6%
UNEMPLOYMENT AMONG WOMEN WITH CHILDREN AGES 6 TO 17 YEARS
97.6/ 100
METRIC RATING
107th/ 347
METRIC RANK
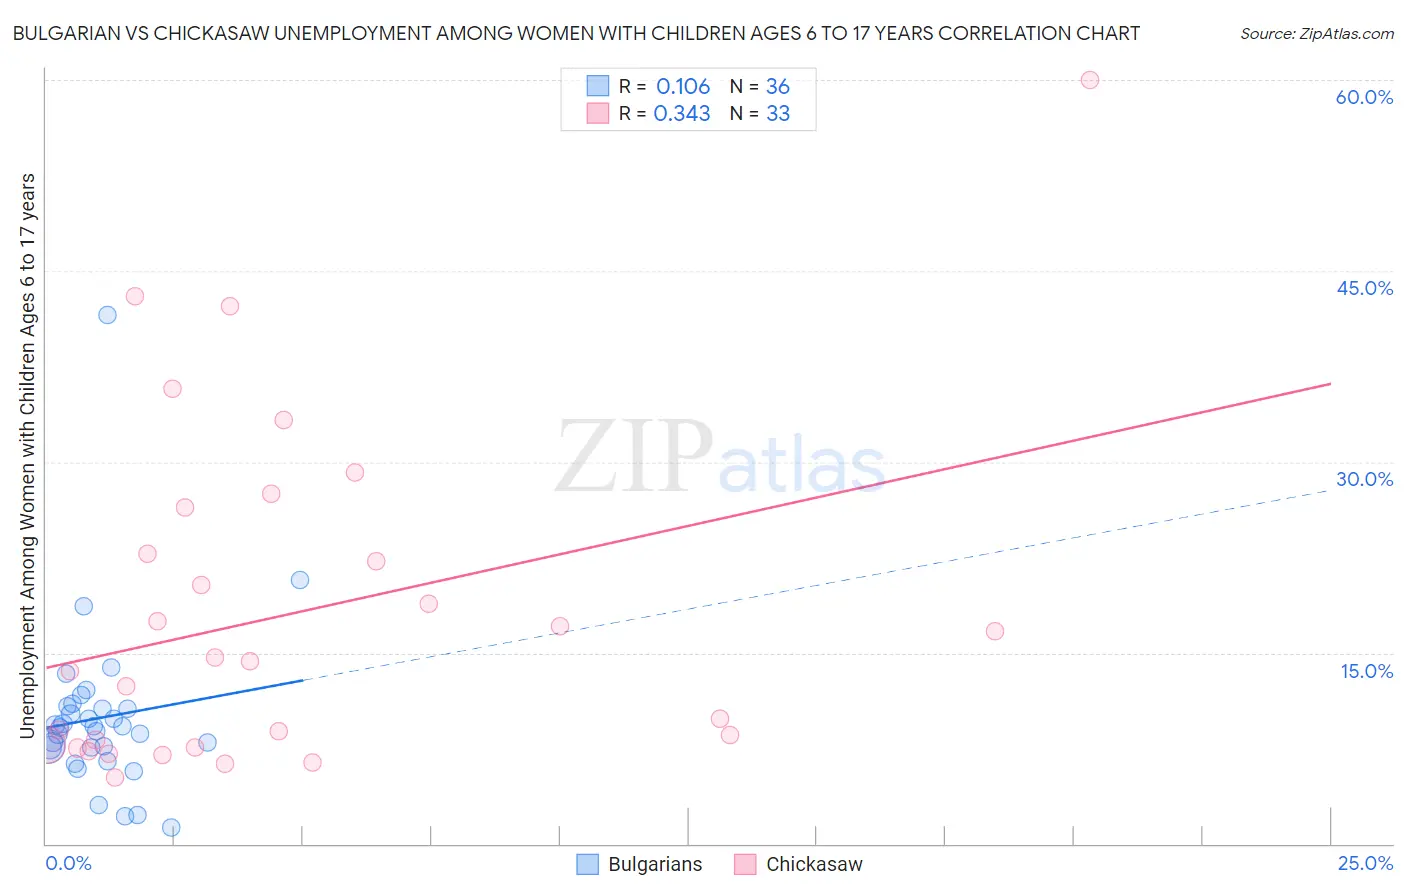
Bulgarian vs Chickasaw Unemployment Among Women with Children Ages 6 to 17 years Correlation Chart
The statistical analysis conducted on geographies consisting of 160,812,255 people shows a poor positive correlation between the proportion of Bulgarians and unemployment rate among women with children between the ages 6 and 17 in the United States with a correlation coefficient (R) of 0.106 and weighted average of 8.4%. Similarly, the statistical analysis conducted on geographies consisting of 124,393,845 people shows a mild positive correlation between the proportion of Chickasaw and unemployment rate among women with children between the ages 6 and 17 in the United States with a correlation coefficient (R) of 0.343 and weighted average of 8.6%, a difference of 1.9%.
Unemployment Among Women with Children Ages 6 to 17 years Correlation Summary
| Measurement | Bulgarian | Chickasaw |
| Minimum | 1.3% | 5.2% |
| Maximum | 41.5% | 60.0% |
| Range | 40.2% | 54.8% |
| Mean | 9.9% | 18.0% |
| Median | 9.2% | 14.3% |
| Interquartile 25% (IQ1) | 7.5% | 7.6% |
| Interquartile 75% (IQ3) | 10.7% | 24.6% |
| Interquartile Range (IQR) | 3.2% | 17.0% |
| Standard Deviation (Sample) | 6.7% | 13.1% |
| Standard Deviation (Population) | 6.6% | 12.9% |
Similar Demographics by Unemployment Among Women with Children Ages 6 to 17 years
Demographics Similar to Bulgarians by Unemployment Among Women with Children Ages 6 to 17 years
In terms of unemployment among women with children ages 6 to 17 years, the demographic groups most similar to Bulgarians are Japanese (8.4%, a difference of 0.12%), Cypriot (8.4%, a difference of 0.16%), Immigrants from North Macedonia (8.5%, a difference of 0.16%), Immigrants from Bolivia (8.4%, a difference of 0.19%), and Alaskan Athabascan (8.5%, a difference of 0.30%).
| Demographics | Rating | Rank | Unemployment Among Women with Children Ages 6 to 17 years |
| Immigrants | Moldova | 99.7 /100 | #76 | Exceptional 8.4% |
| Iraqis | 99.7 /100 | #77 | Exceptional 8.4% |
| Pakistanis | 99.6 /100 | #78 | Exceptional 8.4% |
| Mongolians | 99.6 /100 | #79 | Exceptional 8.4% |
| Immigrants | Belarus | 99.6 /100 | #80 | Exceptional 8.4% |
| Immigrants | Bolivia | 99.6 /100 | #81 | Exceptional 8.4% |
| Cypriots | 99.6 /100 | #82 | Exceptional 8.4% |
| Bulgarians | 99.5 /100 | #83 | Exceptional 8.4% |
| Japanese | 99.5 /100 | #84 | Exceptional 8.4% |
| Immigrants | North Macedonia | 99.4 /100 | #85 | Exceptional 8.5% |
| Alaskan Athabascans | 99.4 /100 | #86 | Exceptional 8.5% |
| Immigrants | Israel | 99.1 /100 | #87 | Exceptional 8.5% |
| Immigrants | Vietnam | 99.1 /100 | #88 | Exceptional 8.5% |
| Paiute | 99.1 /100 | #89 | Exceptional 8.5% |
| Yugoslavians | 99.0 /100 | #90 | Exceptional 8.5% |
Demographics Similar to Chickasaw by Unemployment Among Women with Children Ages 6 to 17 years
In terms of unemployment among women with children ages 6 to 17 years, the demographic groups most similar to Chickasaw are Swedish (8.6%, a difference of 0.010%), Immigrants from Serbia (8.6%, a difference of 0.030%), Immigrants from Norway (8.6%, a difference of 0.070%), Immigrants from Romania (8.6%, a difference of 0.080%), and Latvian (8.6%, a difference of 0.090%).
| Demographics | Rating | Rank | Unemployment Among Women with Children Ages 6 to 17 years |
| New Zealanders | 98.4 /100 | #100 | Exceptional 8.6% |
| Immigrants | Pakistan | 98.4 /100 | #101 | Exceptional 8.6% |
| Immigrants | South Africa | 98.3 /100 | #102 | Exceptional 8.6% |
| Scandinavians | 98.3 /100 | #103 | Exceptional 8.6% |
| Immigrants | France | 98.0 /100 | #104 | Exceptional 8.6% |
| Immigrants | Norway | 97.8 /100 | #105 | Exceptional 8.6% |
| Immigrants | Serbia | 97.7 /100 | #106 | Exceptional 8.6% |
| Chickasaw | 97.6 /100 | #107 | Exceptional 8.6% |
| Swedes | 97.6 /100 | #108 | Exceptional 8.6% |
| Immigrants | Romania | 97.5 /100 | #109 | Exceptional 8.6% |
| Latvians | 97.4 /100 | #110 | Exceptional 8.6% |
| Immigrants | Ukraine | 97.4 /100 | #111 | Exceptional 8.6% |
| Romanians | 97.1 /100 | #112 | Exceptional 8.6% |
| Eastern Europeans | 96.8 /100 | #113 | Exceptional 8.6% |
| Immigrants | Russia | 96.7 /100 | #114 | Exceptional 8.6% |