Okinawan vs Chickasaw Unemployment Among Women with Children Ages 6 to 17 years
COMPARE
Okinawan
Chickasaw
Unemployment Among Women with Children Ages 6 to 17 years
Unemployment Among Women with Children Ages 6 to 17 years Comparison
Okinawans
Chickasaw
7.0%
UNEMPLOYMENT AMONG WOMEN WITH CHILDREN AGES 6 TO 17 YEARS
100.0/ 100
METRIC RATING
5th/ 347
METRIC RANK
8.6%
UNEMPLOYMENT AMONG WOMEN WITH CHILDREN AGES 6 TO 17 YEARS
97.6/ 100
METRIC RATING
107th/ 347
METRIC RANK
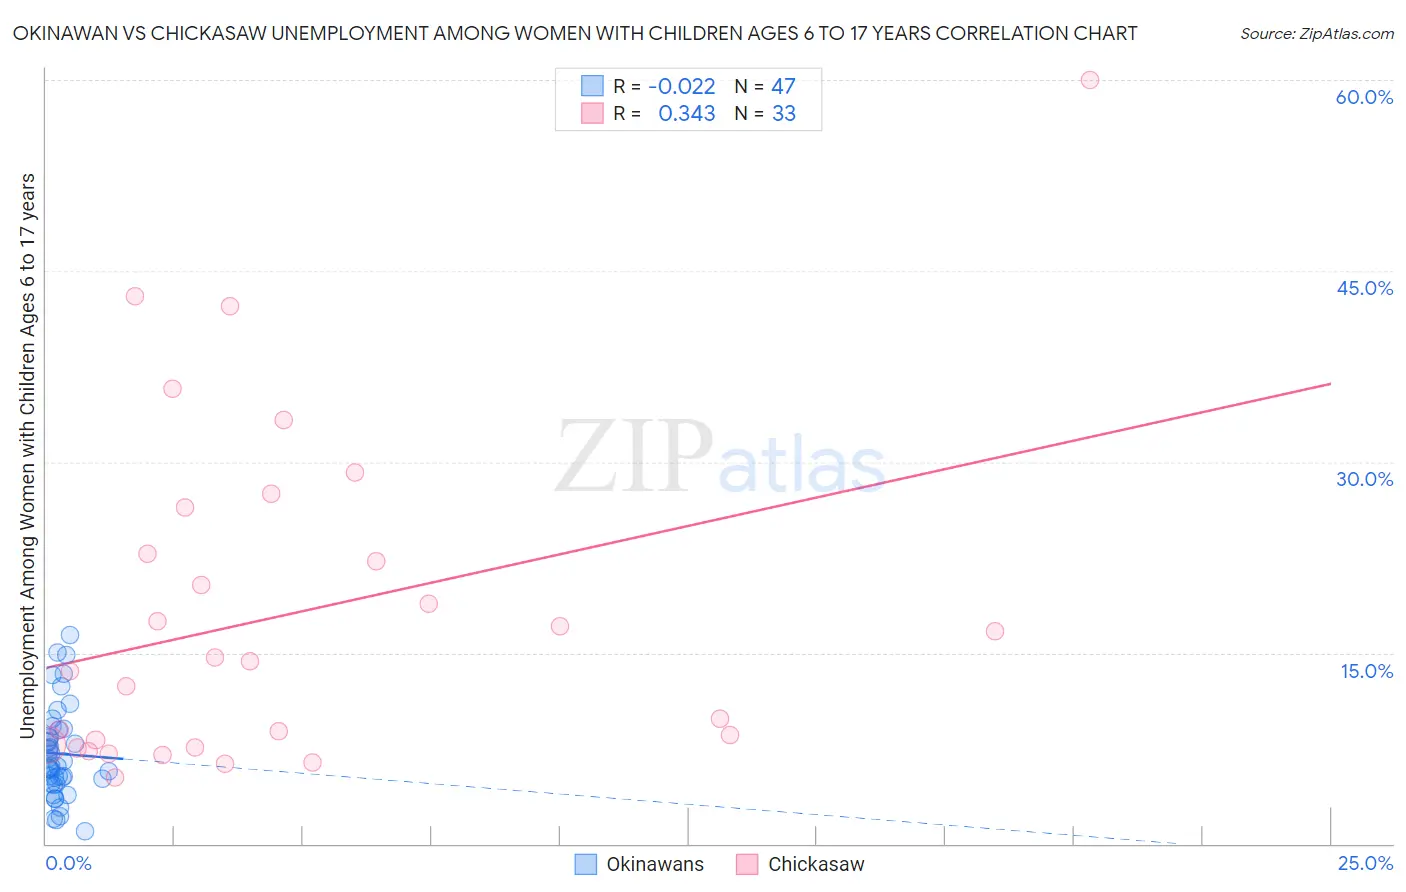
Okinawan vs Chickasaw Unemployment Among Women with Children Ages 6 to 17 years Correlation Chart
The statistical analysis conducted on geographies consisting of 65,822,820 people shows no correlation between the proportion of Okinawans and unemployment rate among women with children between the ages 6 and 17 in the United States with a correlation coefficient (R) of -0.022 and weighted average of 7.0%. Similarly, the statistical analysis conducted on geographies consisting of 124,393,845 people shows a mild positive correlation between the proportion of Chickasaw and unemployment rate among women with children between the ages 6 and 17 in the United States with a correlation coefficient (R) of 0.343 and weighted average of 8.6%, a difference of 22.0%.
Unemployment Among Women with Children Ages 6 to 17 years Correlation Summary
| Measurement | Okinawan | Chickasaw |
| Minimum | 1.0% | 5.2% |
| Maximum | 16.4% | 60.0% |
| Range | 15.4% | 54.8% |
| Mean | 7.1% | 18.0% |
| Median | 6.1% | 14.3% |
| Interquartile 25% (IQ1) | 4.8% | 7.6% |
| Interquartile 75% (IQ3) | 8.9% | 24.6% |
| Interquartile Range (IQR) | 4.1% | 17.0% |
| Standard Deviation (Sample) | 3.6% | 13.1% |
| Standard Deviation (Population) | 3.5% | 12.9% |
Similar Demographics by Unemployment Among Women with Children Ages 6 to 17 years
Demographics Similar to Okinawans by Unemployment Among Women with Children Ages 6 to 17 years
In terms of unemployment among women with children ages 6 to 17 years, the demographic groups most similar to Okinawans are Tlingit-Haida (7.1%, a difference of 0.47%), Soviet Union (7.1%, a difference of 0.53%), Ute (7.0%, a difference of 0.60%), Immigrants from Hong Kong (7.2%, a difference of 2.0%), and Assyrian/Chaldean/Syriac (7.2%, a difference of 2.3%).
| Demographics | Rating | Rank | Unemployment Among Women with Children Ages 6 to 17 years |
| Taiwanese | 100.0 /100 | #1 | Exceptional 6.5% |
| Fijians | 100.0 /100 | #2 | Exceptional 6.6% |
| Tongans | 100.0 /100 | #3 | Exceptional 6.7% |
| Ute | 100.0 /100 | #4 | Exceptional 7.0% |
| Okinawans | 100.0 /100 | #5 | Exceptional 7.0% |
| Tlingit-Haida | 100.0 /100 | #6 | Exceptional 7.1% |
| Soviet Union | 100.0 /100 | #7 | Exceptional 7.1% |
| Immigrants | Hong Kong | 100.0 /100 | #8 | Exceptional 7.2% |
| Assyrians/Chaldeans/Syriacs | 100.0 /100 | #9 | Exceptional 7.2% |
| Immigrants | Fiji | 100.0 /100 | #10 | Exceptional 7.3% |
| Immigrants | Taiwan | 100.0 /100 | #11 | Exceptional 7.3% |
| Bangladeshis | 100.0 /100 | #12 | Exceptional 7.4% |
| Indonesians | 100.0 /100 | #13 | Exceptional 7.4% |
| Sudanese | 100.0 /100 | #14 | Exceptional 7.4% |
| Puget Sound Salish | 100.0 /100 | #15 | Exceptional 7.5% |
Demographics Similar to Chickasaw by Unemployment Among Women with Children Ages 6 to 17 years
In terms of unemployment among women with children ages 6 to 17 years, the demographic groups most similar to Chickasaw are Swedish (8.6%, a difference of 0.010%), Immigrants from Serbia (8.6%, a difference of 0.030%), Immigrants from Norway (8.6%, a difference of 0.070%), Immigrants from Romania (8.6%, a difference of 0.080%), and Latvian (8.6%, a difference of 0.090%).
| Demographics | Rating | Rank | Unemployment Among Women with Children Ages 6 to 17 years |
| New Zealanders | 98.4 /100 | #100 | Exceptional 8.6% |
| Immigrants | Pakistan | 98.4 /100 | #101 | Exceptional 8.6% |
| Immigrants | South Africa | 98.3 /100 | #102 | Exceptional 8.6% |
| Scandinavians | 98.3 /100 | #103 | Exceptional 8.6% |
| Immigrants | France | 98.0 /100 | #104 | Exceptional 8.6% |
| Immigrants | Norway | 97.8 /100 | #105 | Exceptional 8.6% |
| Immigrants | Serbia | 97.7 /100 | #106 | Exceptional 8.6% |
| Chickasaw | 97.6 /100 | #107 | Exceptional 8.6% |
| Swedes | 97.6 /100 | #108 | Exceptional 8.6% |
| Immigrants | Romania | 97.5 /100 | #109 | Exceptional 8.6% |
| Latvians | 97.4 /100 | #110 | Exceptional 8.6% |
| Immigrants | Ukraine | 97.4 /100 | #111 | Exceptional 8.6% |
| Romanians | 97.1 /100 | #112 | Exceptional 8.6% |
| Eastern Europeans | 96.8 /100 | #113 | Exceptional 8.6% |
| Immigrants | Russia | 96.7 /100 | #114 | Exceptional 8.6% |