Bulgarian vs Potawatomi Unemployment Among Women with Children Ages 6 to 17 years
COMPARE
Bulgarian
Potawatomi
Unemployment Among Women with Children Ages 6 to 17 years
Unemployment Among Women with Children Ages 6 to 17 years Comparison
Bulgarians
Potawatomi
8.4%
UNEMPLOYMENT AMONG WOMEN WITH CHILDREN AGES 6 TO 17 YEARS
99.5/ 100
METRIC RATING
83rd/ 347
METRIC RANK
8.5%
UNEMPLOYMENT AMONG WOMEN WITH CHILDREN AGES 6 TO 17 YEARS
99.0/ 100
METRIC RATING
92nd/ 347
METRIC RANK
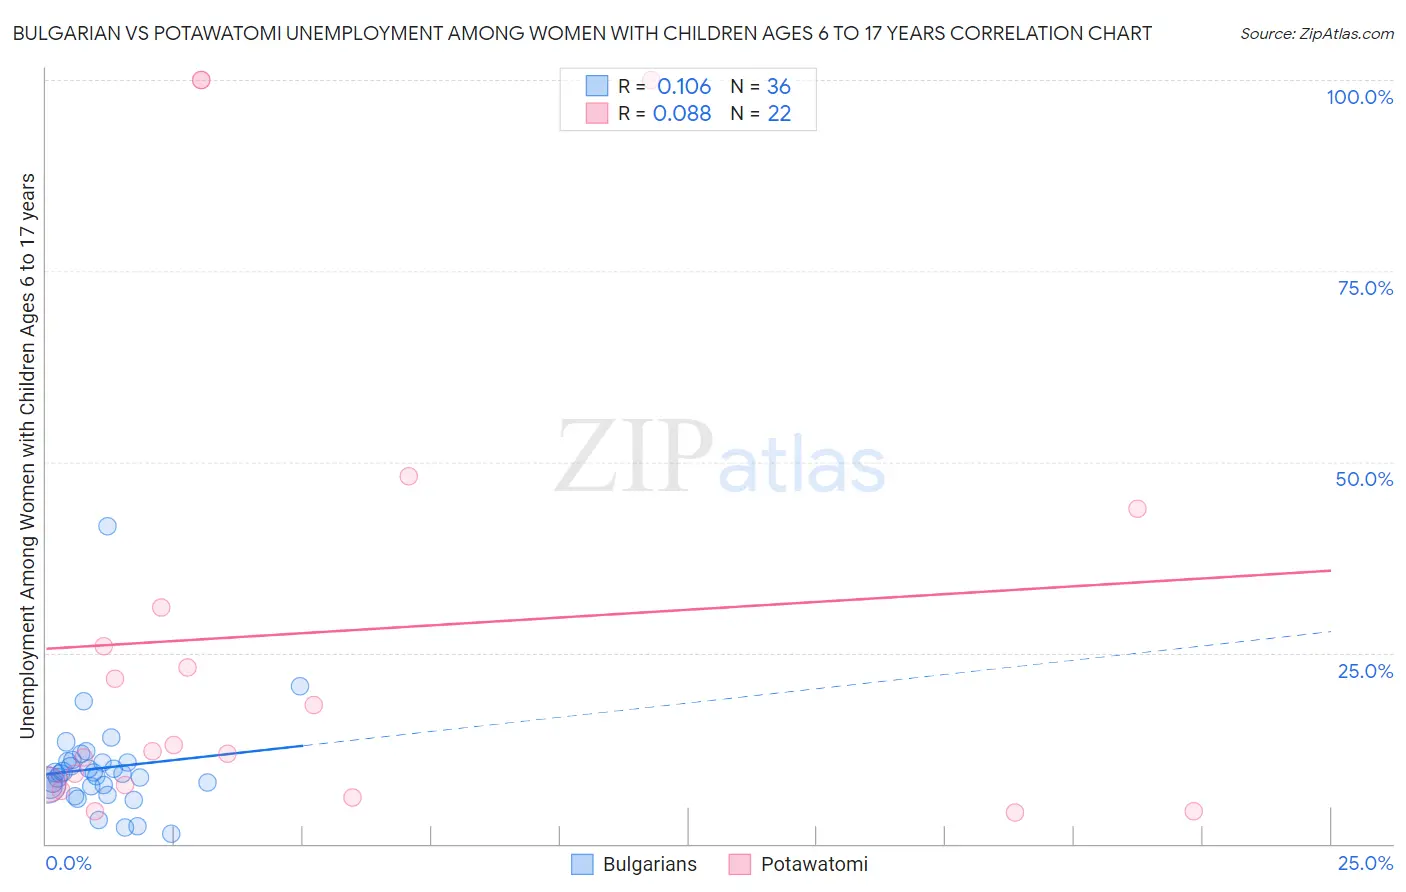
Bulgarian vs Potawatomi Unemployment Among Women with Children Ages 6 to 17 years Correlation Chart
The statistical analysis conducted on geographies consisting of 160,812,255 people shows a poor positive correlation between the proportion of Bulgarians and unemployment rate among women with children between the ages 6 and 17 in the United States with a correlation coefficient (R) of 0.106 and weighted average of 8.4%. Similarly, the statistical analysis conducted on geographies consisting of 100,614,314 people shows a slight positive correlation between the proportion of Potawatomi and unemployment rate among women with children between the ages 6 and 17 in the United States with a correlation coefficient (R) of 0.088 and weighted average of 8.5%, a difference of 0.86%.
Unemployment Among Women with Children Ages 6 to 17 years Correlation Summary
| Measurement | Bulgarian | Potawatomi |
| Minimum | 1.3% | 4.1% |
| Maximum | 41.5% | 100.0% |
| Range | 40.2% | 95.9% |
| Mean | 9.9% | 27.7% |
| Median | 9.2% | 12.5% |
| Interquartile 25% (IQ1) | 7.5% | 7.7% |
| Interquartile 75% (IQ3) | 10.7% | 31.0% |
| Interquartile Range (IQR) | 3.2% | 23.3% |
| Standard Deviation (Sample) | 6.7% | 31.8% |
| Standard Deviation (Population) | 6.6% | 31.0% |
Demographics Similar to Bulgarians and Potawatomi by Unemployment Among Women with Children Ages 6 to 17 years
In terms of unemployment among women with children ages 6 to 17 years, the demographic groups most similar to Bulgarians are Japanese (8.4%, a difference of 0.12%), Cypriot (8.4%, a difference of 0.16%), Immigrants from North Macedonia (8.5%, a difference of 0.16%), Immigrants from Bolivia (8.4%, a difference of 0.19%), and Alaskan Athabascan (8.5%, a difference of 0.30%). Similarly, the demographic groups most similar to Potawatomi are Immigrants from Eastern Europe (8.5%, a difference of 0.030%), Yugoslavian (8.5%, a difference of 0.090%), Australian (8.5%, a difference of 0.12%), Paiute (8.5%, a difference of 0.13%), and Immigrants from Vietnam (8.5%, a difference of 0.21%).
| Demographics | Rating | Rank | Unemployment Among Women with Children Ages 6 to 17 years |
| Iraqis | 99.7 /100 | #77 | Exceptional 8.4% |
| Pakistanis | 99.6 /100 | #78 | Exceptional 8.4% |
| Mongolians | 99.6 /100 | #79 | Exceptional 8.4% |
| Immigrants | Belarus | 99.6 /100 | #80 | Exceptional 8.4% |
| Immigrants | Bolivia | 99.6 /100 | #81 | Exceptional 8.4% |
| Cypriots | 99.6 /100 | #82 | Exceptional 8.4% |
| Bulgarians | 99.5 /100 | #83 | Exceptional 8.4% |
| Japanese | 99.5 /100 | #84 | Exceptional 8.4% |
| Immigrants | North Macedonia | 99.4 /100 | #85 | Exceptional 8.5% |
| Alaskan Athabascans | 99.4 /100 | #86 | Exceptional 8.5% |
| Immigrants | Israel | 99.1 /100 | #87 | Exceptional 8.5% |
| Immigrants | Vietnam | 99.1 /100 | #88 | Exceptional 8.5% |
| Paiute | 99.1 /100 | #89 | Exceptional 8.5% |
| Yugoslavians | 99.0 /100 | #90 | Exceptional 8.5% |
| Immigrants | Eastern Europe | 99.0 /100 | #91 | Exceptional 8.5% |
| Potawatomi | 99.0 /100 | #92 | Exceptional 8.5% |
| Australians | 98.9 /100 | #93 | Exceptional 8.5% |
| Immigrants | Barbados | 98.8 /100 | #94 | Exceptional 8.5% |
| Sri Lankans | 98.7 /100 | #95 | Exceptional 8.5% |
| German Russians | 98.6 /100 | #96 | Exceptional 8.5% |
| Bolivians | 98.5 /100 | #97 | Exceptional 8.5% |