Immigrants from Serbia vs Chickasaw Unemployment Among Women with Children Ages 6 to 17 years
COMPARE
Immigrants from Serbia
Chickasaw
Unemployment Among Women with Children Ages 6 to 17 years
Unemployment Among Women with Children Ages 6 to 17 years Comparison
Immigrants from Serbia
Chickasaw
8.6%
UNEMPLOYMENT AMONG WOMEN WITH CHILDREN AGES 6 TO 17 YEARS
97.7/ 100
METRIC RATING
106th/ 347
METRIC RANK
8.6%
UNEMPLOYMENT AMONG WOMEN WITH CHILDREN AGES 6 TO 17 YEARS
97.6/ 100
METRIC RATING
107th/ 347
METRIC RANK
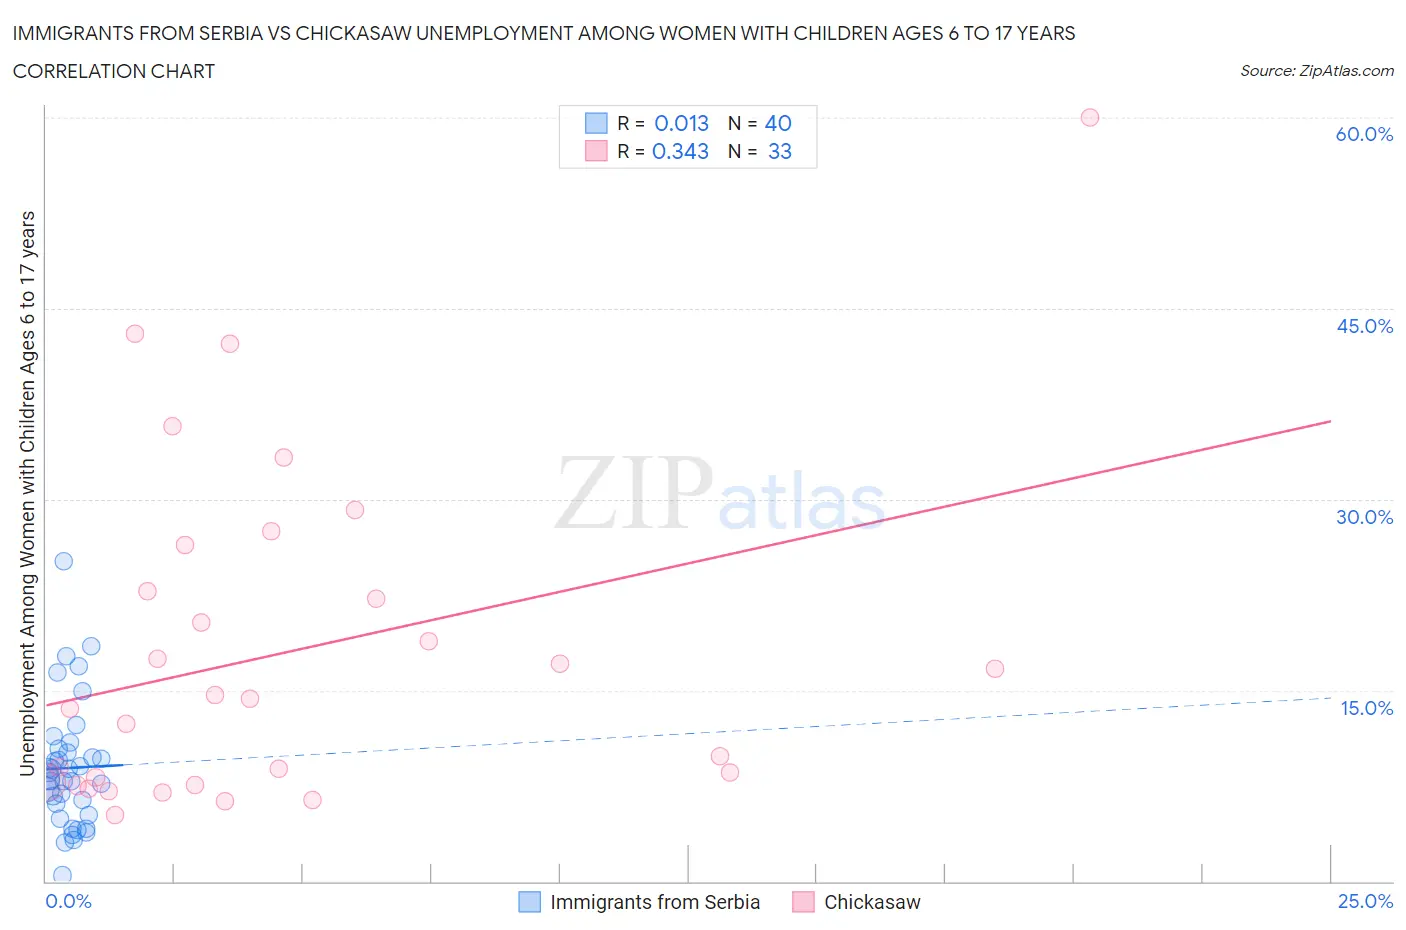
Immigrants from Serbia vs Chickasaw Unemployment Among Women with Children Ages 6 to 17 years Correlation Chart
The statistical analysis conducted on geographies consisting of 109,738,992 people shows no correlation between the proportion of Immigrants from Serbia and unemployment rate among women with children between the ages 6 and 17 in the United States with a correlation coefficient (R) of 0.013 and weighted average of 8.6%. Similarly, the statistical analysis conducted on geographies consisting of 124,393,845 people shows a mild positive correlation between the proportion of Chickasaw and unemployment rate among women with children between the ages 6 and 17 in the United States with a correlation coefficient (R) of 0.343 and weighted average of 8.6%, a difference of 0.030%.
Unemployment Among Women with Children Ages 6 to 17 years Correlation Summary
| Measurement | Immigrants from Serbia | Chickasaw |
| Minimum | 0.44% | 5.2% |
| Maximum | 25.1% | 60.0% |
| Range | 24.7% | 54.8% |
| Mean | 8.9% | 18.0% |
| Median | 8.3% | 14.3% |
| Interquartile 25% (IQ1) | 5.6% | 7.6% |
| Interquartile 75% (IQ3) | 10.3% | 24.6% |
| Interquartile Range (IQR) | 4.7% | 17.0% |
| Standard Deviation (Sample) | 4.9% | 13.1% |
| Standard Deviation (Population) | 4.8% | 12.9% |
Demographics Similar to Immigrants from Serbia and Chickasaw by Unemployment Among Women with Children Ages 6 to 17 years
In terms of unemployment among women with children ages 6 to 17 years, the demographic groups most similar to Immigrants from Serbia are Immigrants from Norway (8.6%, a difference of 0.040%), Swedish (8.6%, a difference of 0.040%), Immigrants from Romania (8.6%, a difference of 0.11%), Latvian (8.6%, a difference of 0.12%), and Immigrants from Ukraine (8.6%, a difference of 0.13%). Similarly, the demographic groups most similar to Chickasaw are Swedish (8.6%, a difference of 0.010%), Immigrants from Norway (8.6%, a difference of 0.070%), Immigrants from Romania (8.6%, a difference of 0.080%), Latvian (8.6%, a difference of 0.090%), and Immigrants from Ukraine (8.6%, a difference of 0.10%).
| Demographics | Rating | Rank | Unemployment Among Women with Children Ages 6 to 17 years |
| German Russians | 98.6 /100 | #96 | Exceptional 8.5% |
| Bolivians | 98.5 /100 | #97 | Exceptional 8.5% |
| Malaysians | 98.5 /100 | #98 | Exceptional 8.6% |
| Immigrants | Lithuania | 98.4 /100 | #99 | Exceptional 8.6% |
| New Zealanders | 98.4 /100 | #100 | Exceptional 8.6% |
| Immigrants | Pakistan | 98.4 /100 | #101 | Exceptional 8.6% |
| Immigrants | South Africa | 98.3 /100 | #102 | Exceptional 8.6% |
| Scandinavians | 98.3 /100 | #103 | Exceptional 8.6% |
| Immigrants | France | 98.0 /100 | #104 | Exceptional 8.6% |
| Immigrants | Norway | 97.8 /100 | #105 | Exceptional 8.6% |
| Immigrants | Serbia | 97.7 /100 | #106 | Exceptional 8.6% |
| Chickasaw | 97.6 /100 | #107 | Exceptional 8.6% |
| Swedes | 97.6 /100 | #108 | Exceptional 8.6% |
| Immigrants | Romania | 97.5 /100 | #109 | Exceptional 8.6% |
| Latvians | 97.4 /100 | #110 | Exceptional 8.6% |
| Immigrants | Ukraine | 97.4 /100 | #111 | Exceptional 8.6% |
| Romanians | 97.1 /100 | #112 | Exceptional 8.6% |
| Eastern Europeans | 96.8 /100 | #113 | Exceptional 8.6% |
| Immigrants | Russia | 96.7 /100 | #114 | Exceptional 8.6% |
| Argentineans | 96.5 /100 | #115 | Exceptional 8.6% |
| Zimbabweans | 96.3 /100 | #116 | Exceptional 8.6% |