Basque vs Belizean Male Unemployment
COMPARE
Basque
Belizean
Male Unemployment
Male Unemployment Comparison
Basques
Belizeans
5.0%
MALE UNEMPLOYMENT
97.9/ 100
METRIC RATING
62nd/ 347
METRIC RANK
6.5%
MALE UNEMPLOYMENT
0.0/ 100
METRIC RATING
295th/ 347
METRIC RANK
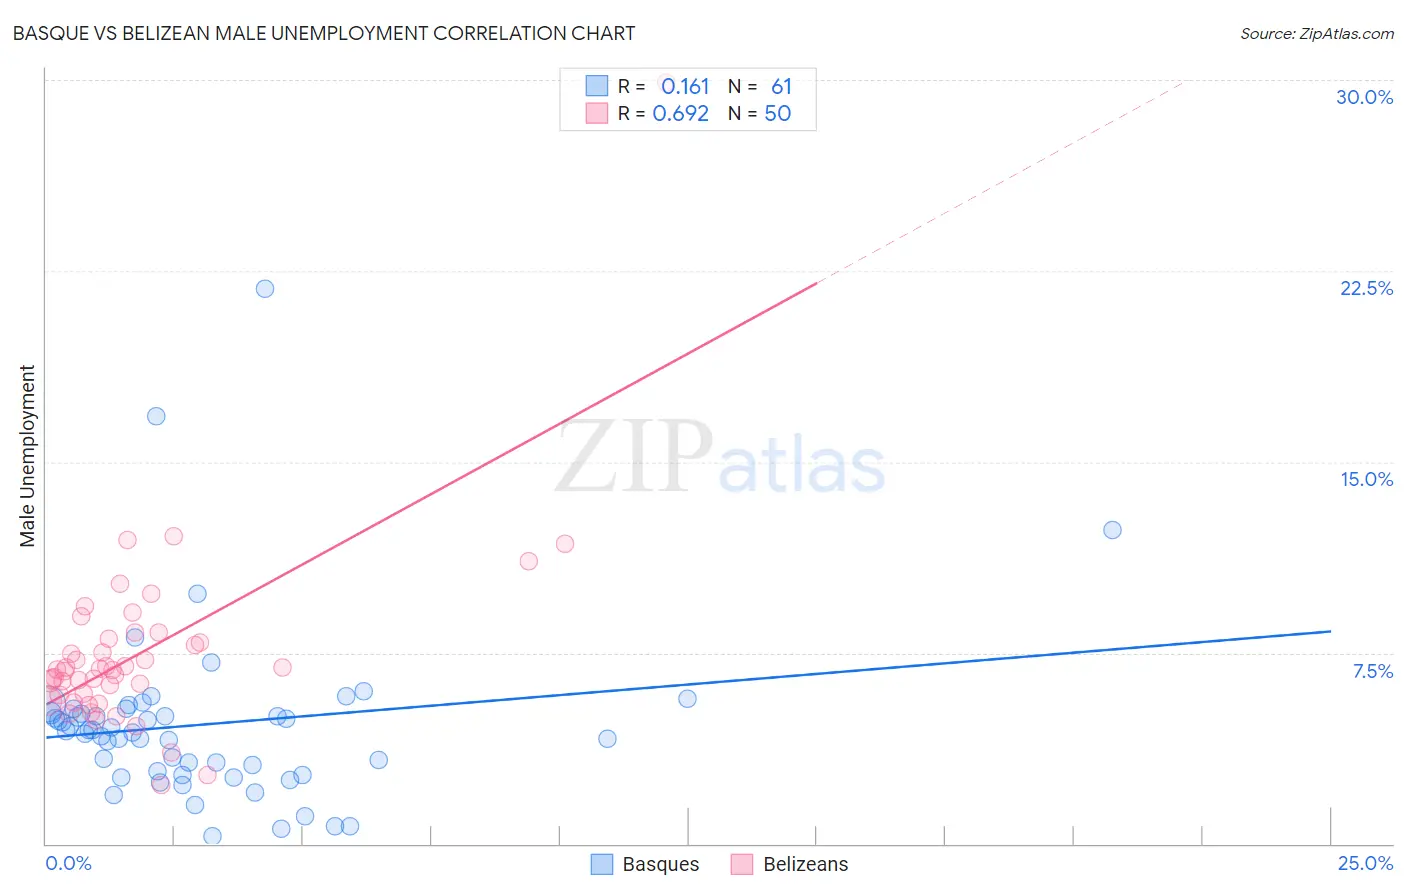
Basque vs Belizean Male Unemployment Correlation Chart
The statistical analysis conducted on geographies consisting of 165,517,364 people shows a poor positive correlation between the proportion of Basques and unemployment rate among males in the United States with a correlation coefficient (R) of 0.161 and weighted average of 5.0%. Similarly, the statistical analysis conducted on geographies consisting of 144,079,260 people shows a significant positive correlation between the proportion of Belizeans and unemployment rate among males in the United States with a correlation coefficient (R) of 0.692 and weighted average of 6.5%, a difference of 30.1%.
Male Unemployment Correlation Summary
| Measurement | Basque | Belizean |
| Minimum | 0.30% | 2.3% |
| Maximum | 21.8% | 29.9% |
| Range | 21.5% | 27.6% |
| Mean | 4.7% | 7.5% |
| Median | 4.4% | 6.8% |
| Interquartile 25% (IQ1) | 2.8% | 5.8% |
| Interquartile 75% (IQ3) | 5.2% | 8.1% |
| Interquartile Range (IQR) | 2.4% | 2.2% |
| Standard Deviation (Sample) | 3.4% | 3.9% |
| Standard Deviation (Population) | 3.4% | 3.8% |
Similar Demographics by Male Unemployment
Demographics Similar to Basques by Male Unemployment
In terms of male unemployment, the demographic groups most similar to Basques are Eastern European (5.0%, a difference of 0.010%), Celtic (5.0%, a difference of 0.030%), Cambodian (5.0%, a difference of 0.13%), Icelander (5.0%, a difference of 0.19%), and Immigrants from Argentina (5.0%, a difference of 0.20%).
| Demographics | Rating | Rank | Male Unemployment |
| Czechoslovakians | 98.7 /100 | #55 | Exceptional 5.0% |
| Immigrants | Bulgaria | 98.7 /100 | #56 | Exceptional 5.0% |
| Turks | 98.5 /100 | #57 | Exceptional 5.0% |
| Lithuanians | 98.5 /100 | #58 | Exceptional 5.0% |
| Immigrants | Netherlands | 98.3 /100 | #59 | Exceptional 5.0% |
| Immigrants | Argentina | 98.1 /100 | #60 | Exceptional 5.0% |
| Cambodians | 98.1 /100 | #61 | Exceptional 5.0% |
| Basques | 97.9 /100 | #62 | Exceptional 5.0% |
| Eastern Europeans | 97.9 /100 | #63 | Exceptional 5.0% |
| Celtics | 97.8 /100 | #64 | Exceptional 5.0% |
| Icelanders | 97.6 /100 | #65 | Exceptional 5.0% |
| Finns | 97.5 /100 | #66 | Exceptional 5.0% |
| Immigrants | Canada | 97.5 /100 | #67 | Exceptional 5.0% |
| Australians | 97.4 /100 | #68 | Exceptional 5.0% |
| Immigrants | Sweden | 97.4 /100 | #69 | Exceptional 5.0% |
Demographics Similar to Belizeans by Male Unemployment
In terms of male unemployment, the demographic groups most similar to Belizeans are Immigrants from Haiti (6.5%, a difference of 0.45%), Chippewa (6.6%, a difference of 0.77%), Senegalese (6.4%, a difference of 0.85%), Jamaican (6.6%, a difference of 0.85%), and Haitian (6.4%, a difference of 0.96%).
| Demographics | Rating | Rank | Male Unemployment |
| Immigrants | Senegal | 0.0 /100 | #288 | Tragic 6.3% |
| Immigrants | Caribbean | 0.0 /100 | #289 | Tragic 6.3% |
| U.S. Virgin Islanders | 0.0 /100 | #290 | Tragic 6.4% |
| Immigrants | Azores | 0.0 /100 | #291 | Tragic 6.4% |
| Nepalese | 0.0 /100 | #292 | Tragic 6.4% |
| Haitians | 0.0 /100 | #293 | Tragic 6.4% |
| Senegalese | 0.0 /100 | #294 | Tragic 6.4% |
| Belizeans | 0.0 /100 | #295 | Tragic 6.5% |
| Immigrants | Haiti | 0.0 /100 | #296 | Tragic 6.5% |
| Chippewa | 0.0 /100 | #297 | Tragic 6.6% |
| Jamaicans | 0.0 /100 | #298 | Tragic 6.6% |
| Immigrants | Bangladesh | 0.0 /100 | #299 | Tragic 6.6% |
| Vietnamese | 0.0 /100 | #300 | Tragic 6.6% |
| Immigrants | Belize | 0.0 /100 | #301 | Tragic 6.6% |
| Ute | 0.0 /100 | #302 | Tragic 6.6% |