Basque vs Immigrants from Grenada Male Unemployment
COMPARE
Basque
Immigrants from Grenada
Male Unemployment
Male Unemployment Comparison
Basques
Immigrants from Grenada
5.0%
MALE UNEMPLOYMENT
97.9/ 100
METRIC RATING
62nd/ 347
METRIC RANK
7.6%
MALE UNEMPLOYMENT
0.0/ 100
METRIC RATING
323rd/ 347
METRIC RANK
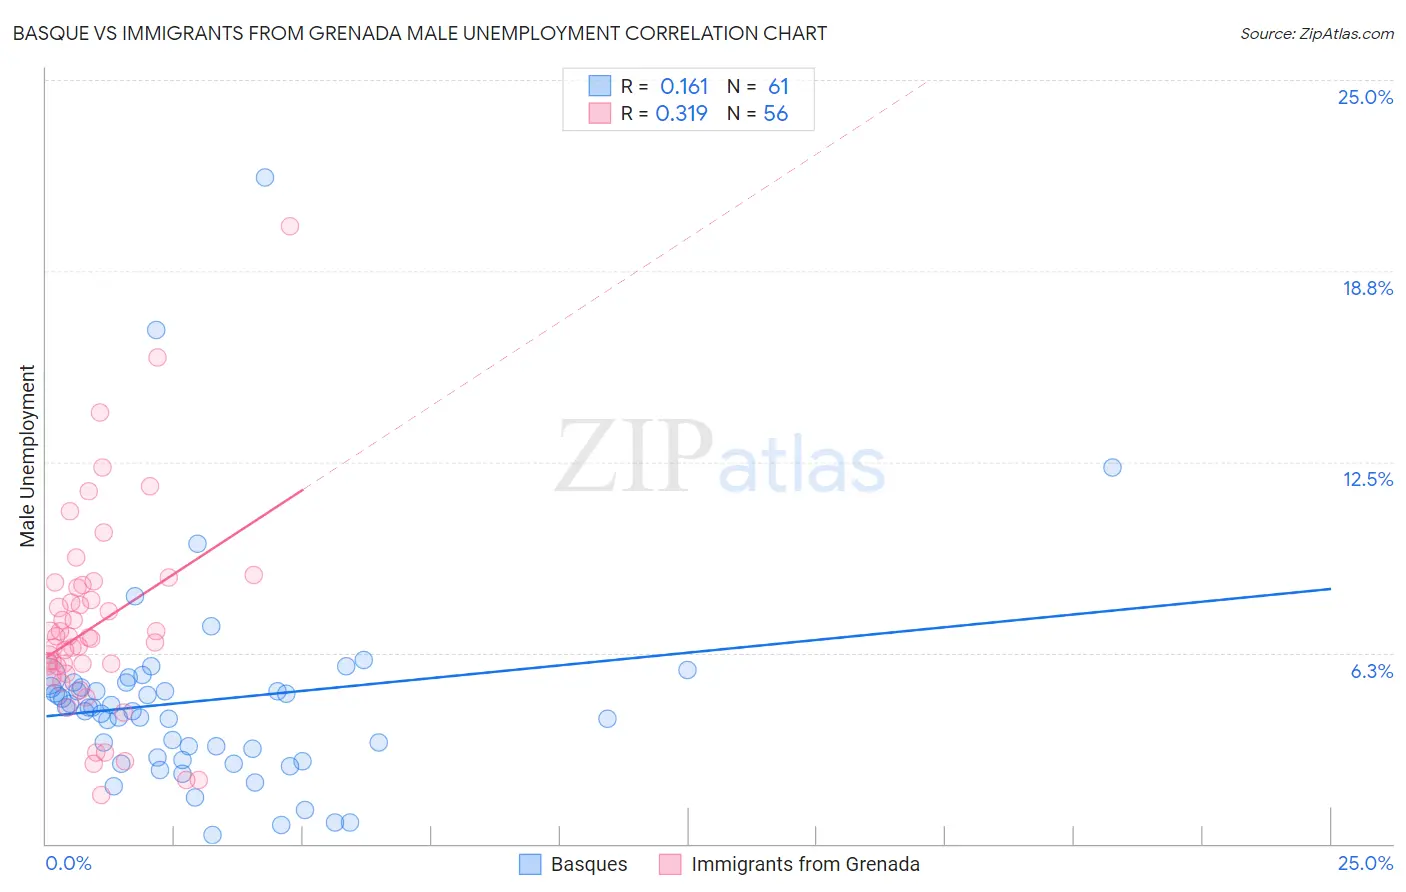
Basque vs Immigrants from Grenada Male Unemployment Correlation Chart
The statistical analysis conducted on geographies consisting of 165,517,364 people shows a poor positive correlation between the proportion of Basques and unemployment rate among males in the United States with a correlation coefficient (R) of 0.161 and weighted average of 5.0%. Similarly, the statistical analysis conducted on geographies consisting of 67,158,645 people shows a mild positive correlation between the proportion of Immigrants from Grenada and unemployment rate among males in the United States with a correlation coefficient (R) of 0.319 and weighted average of 7.6%, a difference of 51.1%.
Male Unemployment Correlation Summary
| Measurement | Basque | Immigrants from Grenada |
| Minimum | 0.30% | 1.6% |
| Maximum | 21.8% | 20.2% |
| Range | 21.5% | 18.6% |
| Mean | 4.7% | 7.2% |
| Median | 4.4% | 6.7% |
| Interquartile 25% (IQ1) | 2.8% | 5.7% |
| Interquartile 75% (IQ3) | 5.2% | 8.4% |
| Interquartile Range (IQR) | 2.4% | 2.7% |
| Standard Deviation (Sample) | 3.4% | 3.3% |
| Standard Deviation (Population) | 3.4% | 3.3% |
Similar Demographics by Male Unemployment
Demographics Similar to Basques by Male Unemployment
In terms of male unemployment, the demographic groups most similar to Basques are Eastern European (5.0%, a difference of 0.010%), Celtic (5.0%, a difference of 0.030%), Cambodian (5.0%, a difference of 0.13%), Icelander (5.0%, a difference of 0.19%), and Immigrants from Argentina (5.0%, a difference of 0.20%).
| Demographics | Rating | Rank | Male Unemployment |
| Czechoslovakians | 98.7 /100 | #55 | Exceptional 5.0% |
| Immigrants | Bulgaria | 98.7 /100 | #56 | Exceptional 5.0% |
| Turks | 98.5 /100 | #57 | Exceptional 5.0% |
| Lithuanians | 98.5 /100 | #58 | Exceptional 5.0% |
| Immigrants | Netherlands | 98.3 /100 | #59 | Exceptional 5.0% |
| Immigrants | Argentina | 98.1 /100 | #60 | Exceptional 5.0% |
| Cambodians | 98.1 /100 | #61 | Exceptional 5.0% |
| Basques | 97.9 /100 | #62 | Exceptional 5.0% |
| Eastern Europeans | 97.9 /100 | #63 | Exceptional 5.0% |
| Celtics | 97.8 /100 | #64 | Exceptional 5.0% |
| Icelanders | 97.6 /100 | #65 | Exceptional 5.0% |
| Finns | 97.5 /100 | #66 | Exceptional 5.0% |
| Immigrants | Canada | 97.5 /100 | #67 | Exceptional 5.0% |
| Australians | 97.4 /100 | #68 | Exceptional 5.0% |
| Immigrants | Sweden | 97.4 /100 | #69 | Exceptional 5.0% |
Demographics Similar to Immigrants from Grenada by Male Unemployment
In terms of male unemployment, the demographic groups most similar to Immigrants from Grenada are Dominican (7.6%, a difference of 0.27%), Shoshone (7.6%, a difference of 0.65%), Immigrants from Dominican Republic (7.6%, a difference of 0.75%), Immigrants from Cabo Verde (7.5%, a difference of 0.79%), and Immigrants from St. Vincent and the Grenadines (7.5%, a difference of 1.1%).
| Demographics | Rating | Rank | Male Unemployment |
| Immigrants | Guyana | 0.0 /100 | #316 | Tragic 7.1% |
| Guyanese | 0.0 /100 | #317 | Tragic 7.1% |
| Cape Verdeans | 0.0 /100 | #318 | Tragic 7.1% |
| British West Indians | 0.0 /100 | #319 | Tragic 7.3% |
| Colville | 0.0 /100 | #320 | Tragic 7.4% |
| Immigrants | St. Vincent and the Grenadines | 0.0 /100 | #321 | Tragic 7.5% |
| Immigrants | Cabo Verde | 0.0 /100 | #322 | Tragic 7.5% |
| Immigrants | Grenada | 0.0 /100 | #323 | Tragic 7.6% |
| Dominicans | 0.0 /100 | #324 | Tragic 7.6% |
| Shoshone | 0.0 /100 | #325 | Tragic 7.6% |
| Immigrants | Dominican Republic | 0.0 /100 | #326 | Tragic 7.6% |
| Paiute | 0.0 /100 | #327 | Tragic 7.7% |
| Natives/Alaskans | 0.0 /100 | #328 | Tragic 7.7% |
| Immigrants | Yemen | 0.0 /100 | #329 | Tragic 7.8% |
| Yakama | 0.0 /100 | #330 | Tragic 7.9% |