Barbadian vs U.S. Virgin Islander Disability Age 18 to 34
COMPARE
Barbadian
U.S. Virgin Islander
Disability Age 18 to 34
Disability Age 18 to 34 Comparison
Barbadians
U.S. Virgin Islanders
6.1%
DISABILITY AGE 18 TO 34
98.3/ 100
METRIC RATING
83rd/ 347
METRIC RANK
6.7%
DISABILITY AGE 18 TO 34
38.6/ 100
METRIC RATING
182nd/ 347
METRIC RANK
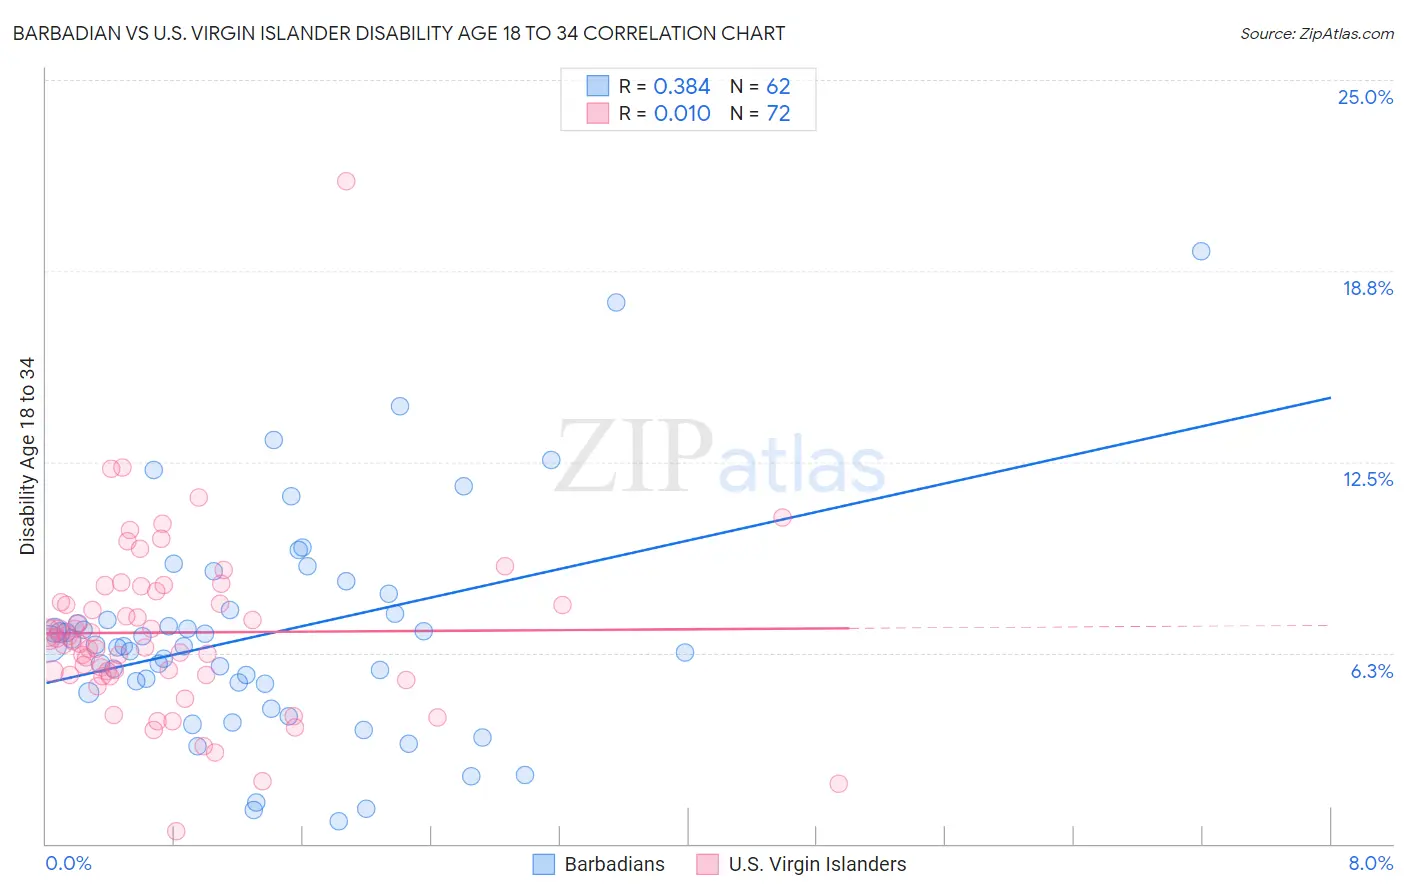
Barbadian vs U.S. Virgin Islander Disability Age 18 to 34 Correlation Chart
The statistical analysis conducted on geographies consisting of 141,268,708 people shows a mild positive correlation between the proportion of Barbadians and percentage of population with a disability between the ages 18 and 35 in the United States with a correlation coefficient (R) of 0.384 and weighted average of 6.1%. Similarly, the statistical analysis conducted on geographies consisting of 87,509,412 people shows no correlation between the proportion of U.S. Virgin Islanders and percentage of population with a disability between the ages 18 and 35 in the United States with a correlation coefficient (R) of 0.010 and weighted average of 6.7%, a difference of 8.4%.
Disability Age 18 to 34 Correlation Summary
| Measurement | Barbadian | U.S. Virgin Islander |
| Minimum | 0.73% | 0.43% |
| Maximum | 19.4% | 21.7% |
| Range | 18.7% | 21.3% |
| Mean | 6.9% | 6.9% |
| Median | 6.5% | 6.7% |
| Interquartile 25% (IQ1) | 5.3% | 5.5% |
| Interquartile 75% (IQ3) | 7.6% | 8.1% |
| Interquartile Range (IQR) | 2.4% | 2.6% |
| Standard Deviation (Sample) | 3.6% | 2.9% |
| Standard Deviation (Population) | 3.6% | 2.9% |
Similar Demographics by Disability Age 18 to 34
Demographics Similar to Barbadians by Disability Age 18 to 34
In terms of disability age 18 to 34, the demographic groups most similar to Barbadians are Israeli (6.1%, a difference of 0.030%), Immigrants from Northern Africa (6.1%, a difference of 0.060%), Immigrants from Ireland (6.1%, a difference of 0.11%), Immigrants from Australia (6.1%, a difference of 0.25%), and Immigrants from Chile (6.1%, a difference of 0.29%).
| Demographics | Rating | Rank | Disability Age 18 to 34 |
| Immigrants | Western Asia | 98.9 /100 | #76 | Exceptional 6.1% |
| Immigrants | Russia | 98.9 /100 | #77 | Exceptional 6.1% |
| Assyrians/Chaldeans/Syriacs | 98.9 /100 | #78 | Exceptional 6.1% |
| Afghans | 98.7 /100 | #79 | Exceptional 6.1% |
| Immigrants | Chile | 98.5 /100 | #80 | Exceptional 6.1% |
| Immigrants | Australia | 98.5 /100 | #81 | Exceptional 6.1% |
| Immigrants | Northern Africa | 98.4 /100 | #82 | Exceptional 6.1% |
| Barbadians | 98.3 /100 | #83 | Exceptional 6.1% |
| Israelis | 98.3 /100 | #84 | Exceptional 6.1% |
| Immigrants | Ireland | 98.2 /100 | #85 | Exceptional 6.1% |
| Immigrants | Kuwait | 98.0 /100 | #86 | Exceptional 6.2% |
| Immigrants | Eastern Europe | 97.9 /100 | #87 | Exceptional 6.2% |
| Cambodians | 97.8 /100 | #88 | Exceptional 6.2% |
| Turks | 97.8 /100 | #89 | Exceptional 6.2% |
| Immigrants | Vietnam | 97.7 /100 | #90 | Exceptional 6.2% |
Demographics Similar to U.S. Virgin Islanders by Disability Age 18 to 34
In terms of disability age 18 to 34, the demographic groups most similar to U.S. Virgin Islanders are Romanian (6.6%, a difference of 0.060%), Immigrants from Austria (6.6%, a difference of 0.070%), Immigrants from Iraq (6.7%, a difference of 0.090%), Iraqi (6.7%, a difference of 0.090%), and Immigrants from Oceania (6.7%, a difference of 0.24%).
| Demographics | Rating | Rank | Disability Age 18 to 34 |
| Immigrants | Cambodia | 46.5 /100 | #175 | Average 6.6% |
| Immigrants | Africa | 45.9 /100 | #176 | Average 6.6% |
| Syrians | 44.3 /100 | #177 | Average 6.6% |
| Nigerians | 43.7 /100 | #178 | Average 6.6% |
| Immigrants | Ghana | 42.1 /100 | #179 | Average 6.6% |
| Immigrants | Austria | 39.6 /100 | #180 | Fair 6.6% |
| Romanians | 39.5 /100 | #181 | Fair 6.6% |
| U.S. Virgin Islanders | 38.6 /100 | #182 | Fair 6.7% |
| Immigrants | Iraq | 37.4 /100 | #183 | Fair 6.7% |
| Iraqis | 37.4 /100 | #184 | Fair 6.7% |
| Immigrants | Oceania | 35.4 /100 | #185 | Fair 6.7% |
| Yup'ik | 35.3 /100 | #186 | Fair 6.7% |
| Maltese | 34.8 /100 | #187 | Fair 6.7% |
| Immigrants | Cameroon | 34.5 /100 | #188 | Fair 6.7% |
| Pakistanis | 33.7 /100 | #189 | Fair 6.7% |